How to Create time related line chart in Pygal?
Last Updated :
10 Jul, 2020
Pygal is a Python module that is mainly used to build SVG (Scalar Vector Graphics) graphs and charts. SVG is a vector-based graphics in the XML format that can be edited in any editor. Pygal can create graphs with minimal lines of code that can be easy to understand and write.
Time related chart
Time-related charts can be plotted using the line charts. A line chart or line graph is a type of chart which helps to displays the information as a series of all data points called ‘markers’ and those markers are connected straight through line segments. To plot time-related we have to format the labels. Look at the below examples for better understanding.
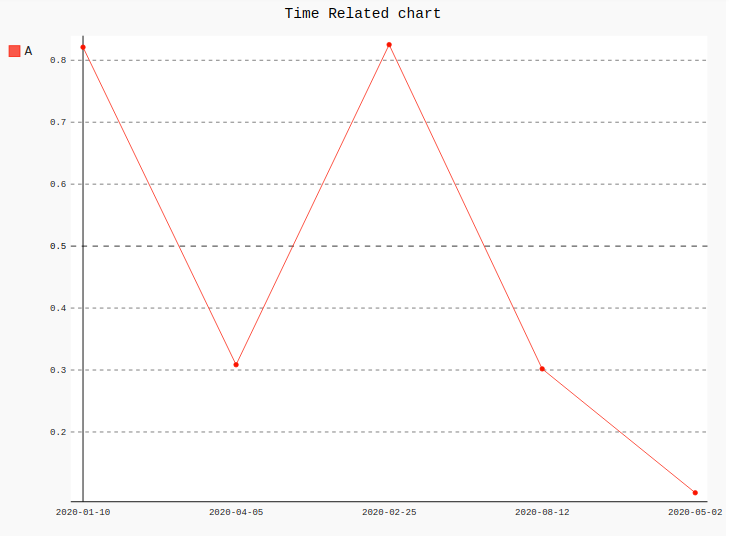
Example 1:
import pygal
from datetime import datetime
import numpy
line_chart = pygal.Line()
line_chart.title = 'Time Related chart'
line_chart.x_labels = map(lambda d: d.strftime('% Y-% m-% d'),
[datetime(2020, 1, 10),
datetime(2020, 4, 5),
datetime(2020, 2, 25),
datetime(2020, 8, 12),
datetime(2020, 5, 2)])
line_chart.add('A', numpy.random.rand(5))
line_chart
|
Output:
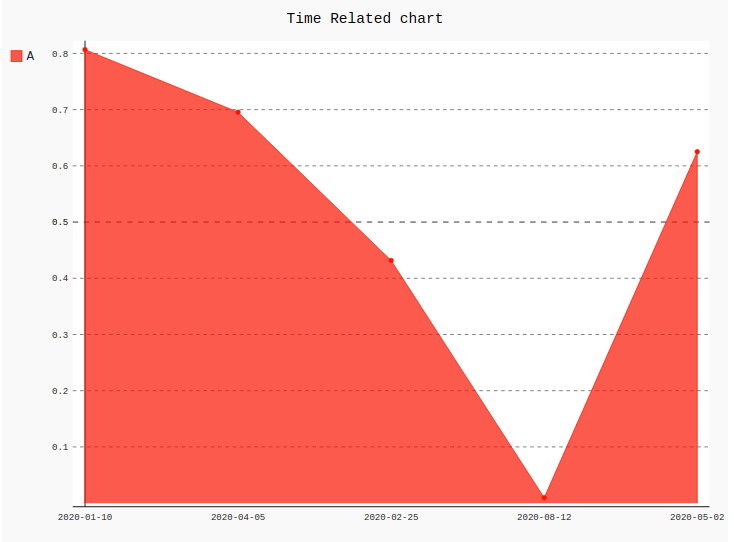
Example 2:
import pygal
from datetime import datetime
import numpy
line_chart = pygal.StackedLine(fill ="True")
line_chart.title = 'Time Related chart'
line_chart.x_labels = map(lambda d: d.strftime('% Y-% m-% d'),
[datetime(2020, 1, 10),
datetime(2020, 4, 5),
datetime(2020, 2, 25),
datetime(2020, 8, 12),
datetime(2020, 5, 2)])
line_chart.add('A', numpy.random.rand(5))
line_chart
|
Output:
Share your thoughts in the comments
Please Login to comment...