How to Create simulated data for classification in Python?
Last Updated :
17 Oct, 2021
In this article, we are going to see how to create simulated data for classification in Python.
We will use the sklearn library that provides various generators for simulating classification data.
Single Label Classification
Here we are going to see single-label classification, for this we will use some visualization techniques.
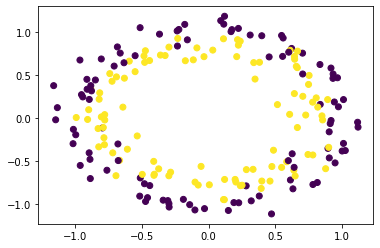
Example 1: Using make_circles()
make_circles generates 2d binary classification data with a spherical decision boundary.
Python3
from sklearn.datasets import make_circles
import pandas as pd
import matplotlib.pyplot as plt
X, y = make_circles(n_samples=200, shuffle=True,
noise=0.1, random_state=42)
plt.scatter(X[:, 0], X[:, 1], c=y)
plt.show()
|
Output:
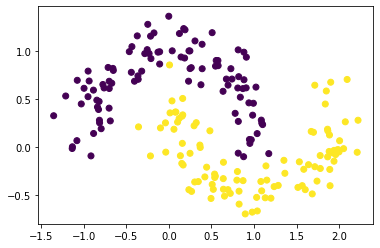
Example 2: Using make_moons()
make_moons() generates 2d binary classification data in the shape of two interleaving half circles.
Python3
from sklearn.datasets import make_moons
import pandas as pd
import matplotlib.pyplot as plt
X, y = make_moons(n_samples=200, shuffle=True,
noise=0.15, random_state=42)
plt.scatter(X[:, 0], X[:, 1], c=y)
plt.show()
|
Output:
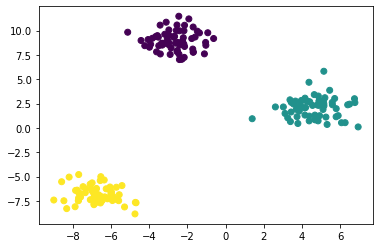
Example 3. Using make_blobs()
make_blobs() generates data in form of blobs that can be used for clustering
Python3
from sklearn.datasets import make_blobs
import pandas as pd
import matplotlib.pyplot as plt
X, y = make_blobs(n_samples=200, n_features=2, centers=3,
shuffle=True, random_state=42)
plt.scatter(X[:, 0], X[:, 1], c=y)
plt.show()
|
Output:
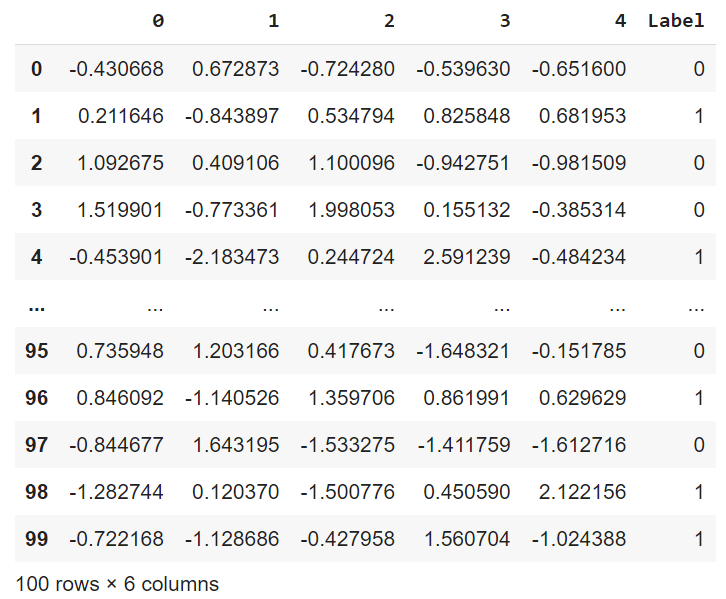
Example 4. Using make_classification()
make_classification() generates a random n-class classification problem
Python3
from sklearn.datasets import make_classification
import pandas as pd
import matplotlib.pyplot as plt
X, y = make_classification(n_samples=100, n_features=5,
n_classes=2,
n_informative=2, n_redundant=2,
n_repeated=0,
shuffle=True, random_state=42)
pd.concat([pd.DataFrame(X), pd.DataFrame(
y, columns=['Label'])], axis=1)
|
Output:
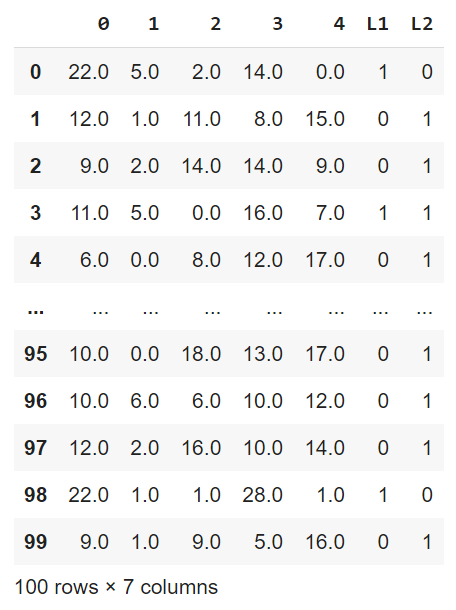
Multi-Label Classification
make_multilabel_classification() generates a random multi-label classification problem.
Python3
from sklearn.datasets import make_multilabel_classification
import pandas as pd
import matplotlib.pyplot as plt
X, y = make_multilabel_classification(n_samples=100, n_features=5,
n_classes=2, n_labels=1,
allow_unlabeled=False,
random_state=42)
pd.concat([pd.DataFrame(X), pd.DataFrame(y,
columns=['L1', 'L2'])],
axis=1)
|
Output:
Like Article
Suggest improvement
Share your thoughts in the comments
Please Login to comment...