How to create scatter chart in react using material UI and DevExpress ?
Last Updated :
12 Dec, 2023
This article will help us learn how to create scatter charts using the material UI library and devexpress using React JS.
DevExpress: DevExpress is a package for controlling and building the user interface of Windows, Mobile, and other applications.
Scatter Charts: A scatter chart is a set of dotted points representing individual data pieces on the horizontal and vertical axis. In a graph in which the values of two variables are plotted along the X-axis and Y-axis, the pattern of the resulting points reveals a correlation between them.
Prerequisites:
Approach:
- Data Setup:
- The
data array contains sample x and y coordinates.
- Chart Component Structure:
- The
Chart component renders a scatter plot using ArgumentAxis, ValueAxis, and ScatterSeries.
- Material-UI Integration:
- The chart is enclosed in a Material-UI
Paper component for a styled background.
Steps to create React Application And Installing Module:
Step 1: Create a React application using the following command.
npx create-react-app foldername
Step 2: After creating your project folder i.e. folder name, move to it using the following command.
cd foldername
Step 3: After creating the ReactJS application, install the required modules using the following command.
npm i --save @devexpress/dx-react-core @devexpress/dx-react-chart
npm install @material-ui/core
npm i --save @devexpress/dx-react-chart-material-ui
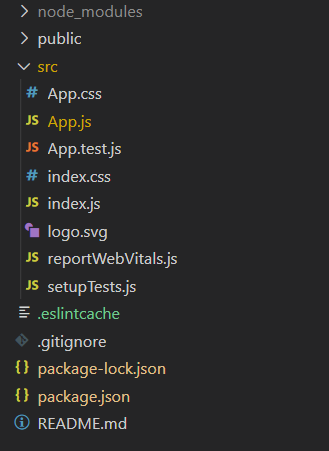
Project Structure:

Project Structure
The updated dependencies in package.json file will look like:
"dependencies": {
    "@devexpress/dx-react-chart": "^4.0.6",
    "@devexpress/dx-react-chart-material-ui": "^4.0.6",
    "@devexpress/dx-react-core": "^4.0.6",
    "@material-ui/core": "^4.12.4",
    "react": "^18.2.0",
    "react-dom": "^18.2.0",
    "react-scripts": "5.0.1",
    "web-vitals": "^2.1.4",
}
Example: Now write down the following code in the App.js file.
Javascript
import React from "react";
import Paper from '@material-ui/core/Paper';
import {
ArgumentAxis,
ValueAxis,
Chart,
ScatterSeries,
} from '@devexpress/dx-react-chart-material-ui';
const App = () => {
const data = [
{ x: 1, y: 2 },
{ x: 1.2, y: 3 },
{ x: 1.3, y: 5 },
{ x: 1.7, y: 4 },
{ x: 1.9, y: 1 },
{ x: 2, y: 2 },
{ x: 2.3, y: 4 },
{ x: 2.6, y: 3 },
{ x: 2.9, y: 3 },
{ x: 3.2, y: 1 },
{ x: 3.5, y: 5 },
{ x: 3.8, y: 4 },
{ x: 4, y: 5 },
{ x: 4.2, y: 3 },
{ x: 4.4, y: 1 },
];
return (
<Paper>
<Chart data={data}>
<ArgumentAxis />
<ValueAxis />
<ScatterSeries valueField="y" argumentField="x" />
</Chart>
</Paper>
);
}
export default App;
|
Step to Run Application: Run the application using the following command from the root directory of the project:
npm start
Output: Now open your browser and go to http://localhost:3000:

Output
Like Article
Suggest improvement
Share your thoughts in the comments
Please Login to comment...