How to Create Frequency Tables in Python?
Last Updated :
20 Feb, 2022
In this article, we are going to see how to Create Frequency Tables in Python
Frequency is a count of the number of occurrences a particular value occurs or appears in our data. A frequency table displays a set of values along with the frequency with which they appear. They allow us to better understand which data values are common and which are uncommon. These tables are a great method to arrange your data and communicate the results to others. In this article let’s demonstrate the different ways in which we can create frequency tables in python.
To view and download the CSV file we use in this article click here.
Method 1: Simple frequency table using value_counts() method
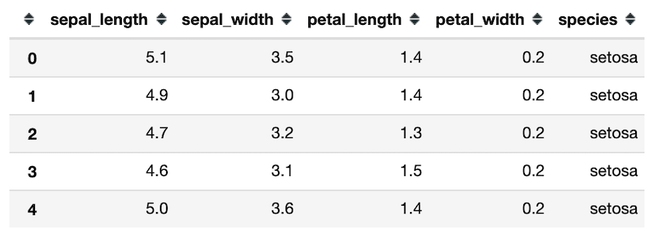
Let’s take a look at the dataset we’ll work on :
The necessary packages are imported and the dataset is read using the pandas.read_csv() method. df.head() method returns the first 5 rows of the dataset.
Python3
import pandas as pd
import numpy as np
data = pd.read_csv('iris.csv')
data.head()
|
Output:
Now let’s find the one-way frequency table of the species column of the dataset.
Python3
df = data['species'].value_counts()
print(df)
|
Output:
setosa        50
virginica     50
versicolor    50
Name: species, dtype: int64
Method 2: One-way frequency table using pandas.crosstab() method
Here we are going to use crosstab() method to get the frequency.
Syntax: pandas.crosstab(index, columns, values=None, rownames=None, colnames=None, aggfunc=None, margins=False, margins_name=’All’, dropna=True, normalize=False)
Parameters:
- index: array or series which contain values to group by in the rows.
- columns: array or series which contain values to group by in the columns.it’s name we give to the column we find frequency
- values : An array of numbers that will be aggregated based on the factors.
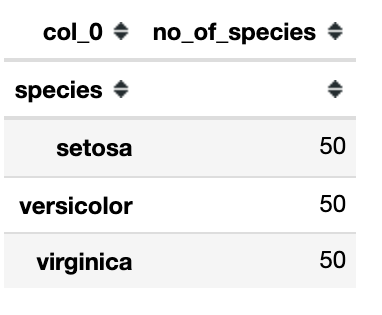
In the below code we use the crosstab function where we give the species column as an index and ‘no_of_species’ as the name of the frequency column.
Python3
import pandas as pd
import numpy as np
import matplotlib.pyplot as plt
%matplotlib inline
data = pd.read_csv('iris.csv')
freq_table = pd.crosstab(data['species'], 'no_of_species')
freq_table
|
Output: 50 plants belonging to the setosa species, 50 of Versicolor and 50 of Virginica.
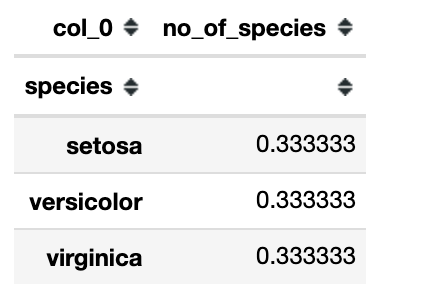
If we want the frequency table to be in proportions then we’ve to divide each individual proportion by the sum of the total number.
Python3
import pandas as pd
import numpy as np
import matplotlib.pyplot as plt
%matplotlib inline
data = pd.read_csv('iris.csv')
freq_table = pd.crosstab(data['species'], 'no_of_species')
freq_table= freq_table/len(data)
freq_table
|
Output: 0.333 indicates 0.333% of the total population is setosa and so on.
Method 3: Two-way frequency table using pandas.crosstab() method
Two – way frequency table is where we create a frequency table for two different features in our dataset. To download and review the CSV file used in this example click here. In the below example we create a two-way frequency table for the ship mode and segment columns of our dataset.
Python3
import pandas as pd
import numpy as np
data = pd.read_csv('SampleSuperstore.csv')
freq_table = pd.crosstab(data['Ship Mode'], data['Segment'])
freq_table
|
Output:
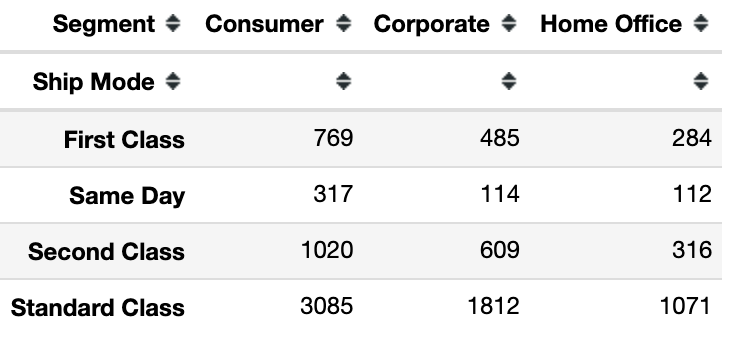
We can interpret this table as for ship mode first class there are 769 consumer segments, 485 corporate segments and 284 home office segments, and so on.
Like Article
Suggest improvement
Share your thoughts in the comments
Please Login to comment...