How to create boxplot using ggplot2 without whiskers in R?
Last Updated :
31 Oct, 2022
A box plot is a method to represent the group of numerical data in the form of quartiles. The quartiles are the values at a particular percentile in the whole dataset. Box plots indicate the five-number summary of the set of data. The five-number summary has the value of the data as a minimum, first quartile, second quartile (median), third quartile, and maximum.
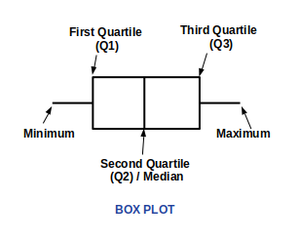
As shown in the above image, a box plot also has whiskers from the first quartile to minimum and from the third quartile to maximum. This article focuses on displaying a boxplot without whiskers.
Components of Boxplot
- Minimum : The lowest value in the dataset excluding outliers.
- First Quartile (Q1) : The value in the dataset at 25th Percentile.
- Second Quartile (Q2) : The value in the dataset at 50th Percentile. It is also known as the median of the data.
- Third Quartile (Q3) : The value in the dataset at 75th Percentile.
- Maximum : The highest value in the dataset excluding outliers.
- Interquartile Range (IQR) : The distance between first quartile (Q1) and third quartile (Q3). IQR is defined as follows :

- Whiskers : The lines shown above from minimum to Q1 and Q3 to maximum are whiskers.
- Outliers : Any values less than minimum and greater than maximum are the outliers of the data.
Function used:
Syntax: boxplot(x, data, notch, varwidth, names, main)
Parameters:
- x: This parameter sets as a vector or a formula.
- data: This parameter sets the data frame.
- notch: This parameter is the label for horizontal axis.
- varwidth: This parameter is a logical value. Set as true to draw width of the box proportionate to the sample size.
- main: This parameter is the title of the chart.
- names: This parameter are the group labels that will be showed under each boxplot.
Program 1: Regular boxplot
R
x <- 1:20
y <- sample(1000,20, replace = TRUE)
df <- data.frame(x,y)
library(ggplot2)
ggplot(df, aes(x,y, group =1))+geom_boxplot()
|
Output :
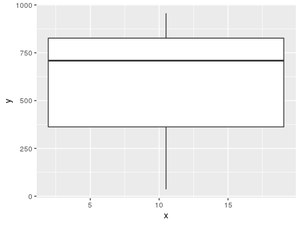
Boxplot with whiskers
Now for creating the same plot without whiskers coef parameter of the geom_boxplot() function should set to 0. Here, parameter coef is the length of the whiskers as the multiple of IQR. The default value is 1.5 but here we have set it to 0. So, the whiskers are eliminated.
Approach
- Import library
- Create data
- Create data frame
- Plot boxplot without whiskers
Program 2:
R
x <- 1:20
y <- sample(1000,20, replace = TRUE)
df <- data.frame(x,y)
library(ggplot2)
ggplot(df,aes(x,y, group =1))+geom_boxplot(coef=0)
|
Output :
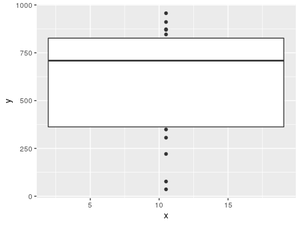
Boxplot without whiskers
Like Article
Suggest improvement
Share your thoughts in the comments
Please Login to comment...