How to Create an Empty Plot in R ?
Last Updated :
16 May, 2021
In this article, we will discuss how to create an empty plot in R. Before moving to create the empty plot let’s first discuss what is an empty plot? The plot on which nothing is plotted is known as an empty plot also known as a blank plot.
R language provides the plot() function to draw the plot.
Syntax: plot(x,y,…)
Parameters:
- x stands for the x-axis
- y stands for the y-axis
- … stands for the other features like title, color etc
Now we discuss some methods through which we can create an empty plot:
Method 1: Using plot.new()
The plot.new() function will create the empty plot. This will give a signal to R that a new window of the plot is created. So, an empty window of the plot is created with the help of this function.
Output:
fig 1: Empty plot
Method 2: Using plot.window()
The plot.window() function will create the empty plot. This will give a signal to R that a new window of the plot is created. So, an empty window of the plot is created with the help of this function. But the arguments are necessary for this function to set the limit of the plot. So in this, we give the limits of both the axis.
R
plot.window(xlim = c(0 , 1), ylim = c( 5, 10))
|
Output:
fig 2: Empty plot
Method 3: Using plot()
The plot function is used to create a plot. So, in this method first, we create the plot using the plot function and then we remove the dots or the data which is plotted on the plot. To remove the plotted data we use the type = “n” as an argument in the plot function here “n” is used to remove the plotted data.
R
plot(1, type = "n", xlab = "",
ylab = "", xlim = c(0, 5),
ylim = c(0, 5))
|
Output :
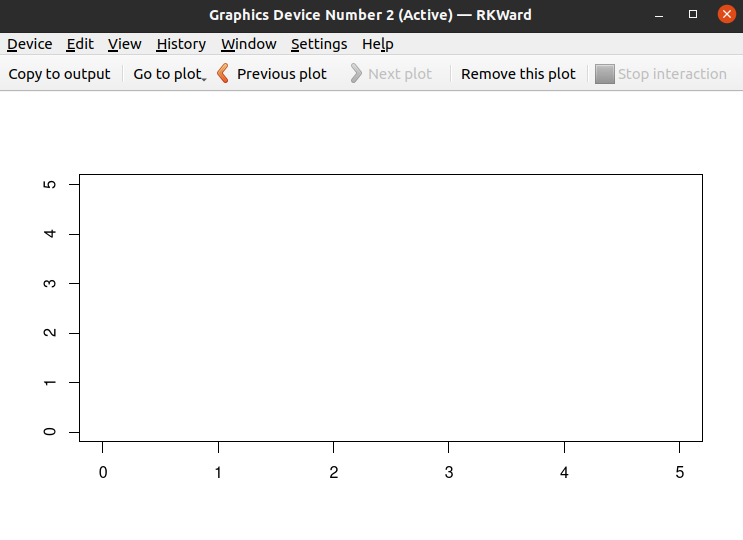
fig 3: Plot with removed data
Like Article
Suggest improvement
Share your thoughts in the comments
Please Login to comment...