How to create a Ternary Overlay using Plotly?
Last Updated :
01 Oct, 2020
A Plotly is a Python library that is used to design graphs, especially interactive graphs. It can plot various graphs and charts like histogram, barplot, boxplot, spreadplot, and many more. It is mainly used in data analysis as well as financial analysis. plotly is an interactive visualization library
Creating Ternary Scatter Plot
A ternary scatter plot is a ternary plot with symbols for each location based on a required class column and the sum of the three data points (X + Y + Z) in any row must equal 100 percent.
Syntax: scatter_ternary( a=None, b=None, c=None, color=None,labels={},width=None, height=None)
Parameters:
a: Values from this column or array_like are used to position marks along the a axis in ternary coordinates.
b: Values from this column or array_like are used to position marks along the b axis in ternary coordinates.
c: Values from this column or array_like are used to position marks along the c axis in ternary coordinates.
color: Either a name of a column in data_frame, or a pandas Series or array_like object. Values from this column or array_like are used to assign color to marks.
width: The figure width in pixels.
height: The figure height in pixels.
Example:
Python3
import plotly.express as px
df = px.data.iris()
fig = px.scatter_ternary(df, a="sepal_length",
b="sepal_width", c="petal_length",
color="species", size_max=20)
fig.show()
|
Output:

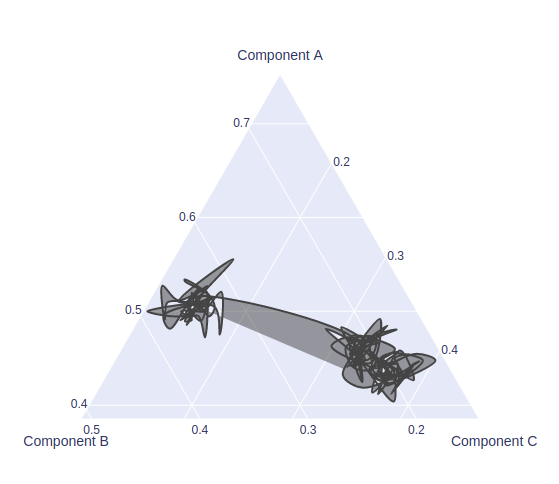
Creating Ternary Contour Plot
A ternary contour plot is a graphical representation that shows 3 dimension surface by plotting constant z slices, called contours, on a 2-dimensional format.
Example:
Python3
import plotly.express as px
import plotly.graph_objects as go
df = px.data.iris()
fig = go.Figure(go.Scatterternary({
'mode': 'lines',
'a': df['sepal_length'],
'b': df['sepal_width'],
'c': df['petal_length'],
'line': {'color': '#444', 'shape': 'spline'},
'marker': {
'color': 'green',
'size': 14,
'line': {'width': 2}
}
}))
fig.show()
|
Like Article
Suggest improvement
Share your thoughts in the comments
Please Login to comment...