How to Create a Relative Frequency Histogram in R?
Last Updated :
04 Jan, 2022
In this article, we will discuss how to create a Relative Frequency Histogram in the R programming language.
Relative Frequency Histogram helps us to visualize the relative frequencies of values in a dataset. This shows how often a certain value is present in the dataset. A relative frequency histogram gives an empirical approximation to the probability density function of data.
To create a Relative Frequency Histogram in the R Language, we use the histogram() function of the lattice package library. The histogram() function takes the data vector as an argument and returns a relative frequency histogram. By default, the Histogram() function provides a color theme according to the current, active theme.
Syntax:
histogram( data, type )
Parameter:
- data: determines the data vector to be plotted.
- type: determines the type of relative frequency histogram that includes percent, count, and density.
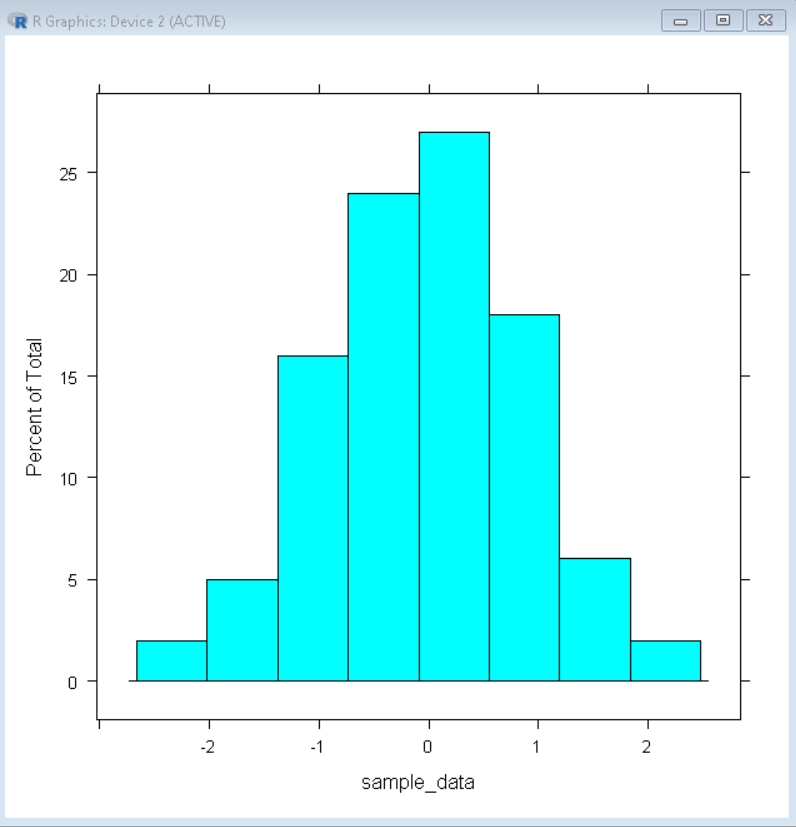
Example: Example of a basic relative frequency histogram with default configuration in the R Language.
R
library(lattice)
sample_data <- rnorm(100)
histogram( sample_data )
|
Output:
Color and label customization
To change the color of the bars of the histogram, we use the col argument of the histogram() function. To change the label of the x-axis and y-axis, we use the xlab and ylab arguments respectively. To add a title to the plot we use the main argument of the histogram() function.
Syntax:
histogram( data, col, xlab, ylab, main )
Parameter:
- col: determines the color of bars/bins.
- xlab and ylab: determine the label of the x-axis and y-axis respectively.
- main: determines the title of plot.
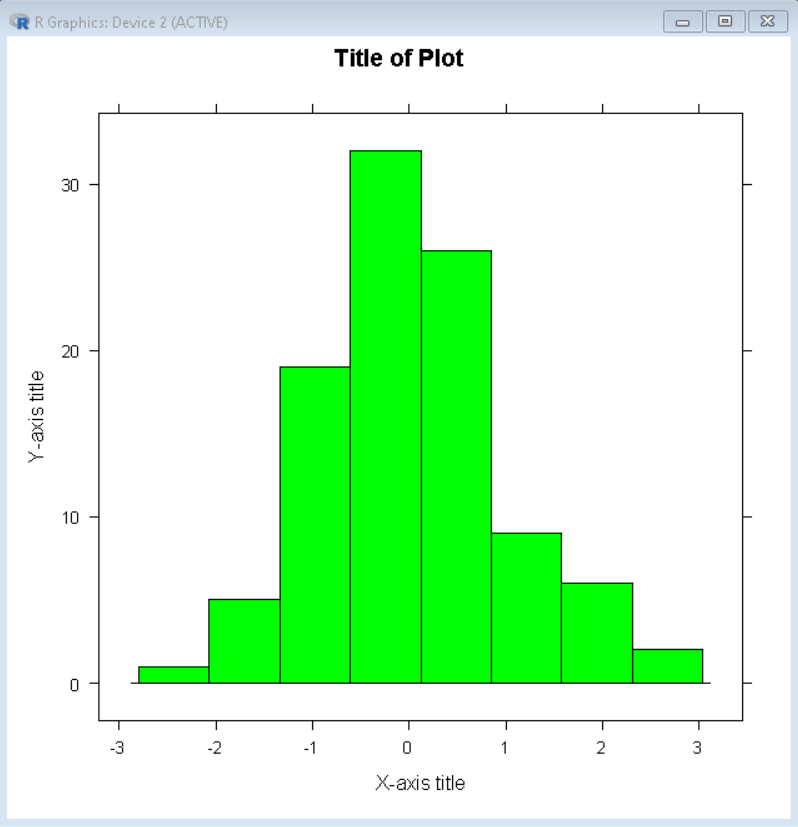
Example: Example of a customized relative frequency histogram with green colored bars and custom labels.
R
library(lattice)
sample_data <- rnorm(100)
histogram( sample_data, col="green", main="Title of Plot",
xlab="X-axis title", ylab="Y-axis title")
|
Output:
Bin/Bar Count Customization
To customize the number of bins/bars in the relative frequency histogram, we can use the breaks argument of the histogram() function. The breaks argument takes a number of bins as value and breaks the plot into that many bars. By using the breaks argument, we can increase as well as decrease the number of bars based on the value.
Syntax:
histogram( data, breaks )
Parameter:
- data: determines the data vector to be plotted.
- breaks: determines the number of bars in the histogram.
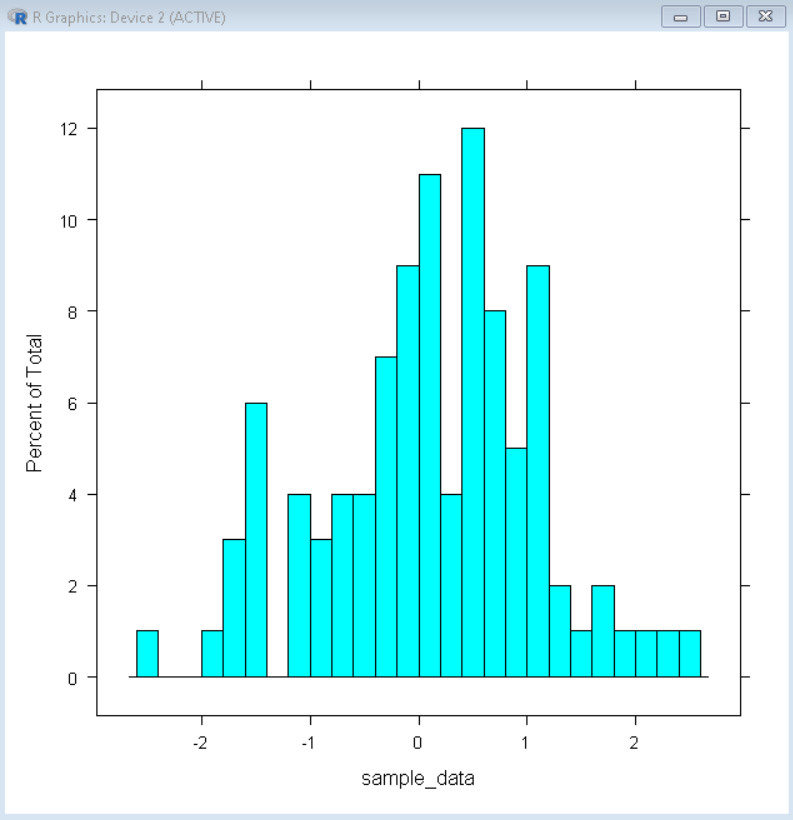
Example: Example of a relative frequency histogram with 20 bars customized using the breaks argument of the histogram() function.
R
library(lattice)
sample_data <- rnorm(100)
histogram( sample_data, breaks=20)
|
Output:
Like Article
Suggest improvement
Share your thoughts in the comments
Please Login to comment...