How to Create a Pivot table with multiple indexes from an excel sheet using Pandas in Python?
Last Updated :
28 Jul, 2020
The term Pivot Table can be defined as the Pandas function used to create a spreadsheet-style pivot table as a DataFrame. It can be created using the pivot_table() method.
Syntax: pandas.pivot_table(data, index=None)
Parameters:
data : DataFrame
index: column, Grouper, array, or list of the previous
index: It is the feature that allows you to group your data.
Returns: DataFrame
Note: We can filter the table further by adding the optional parameters.
Example 1: Link to the CSV File: CSV FILE
We can have a look at the data by running the following program:
Python3
import pandas as pd
df=pd.read_csv('GeeksForGeeks.csv')
df
|
Output:
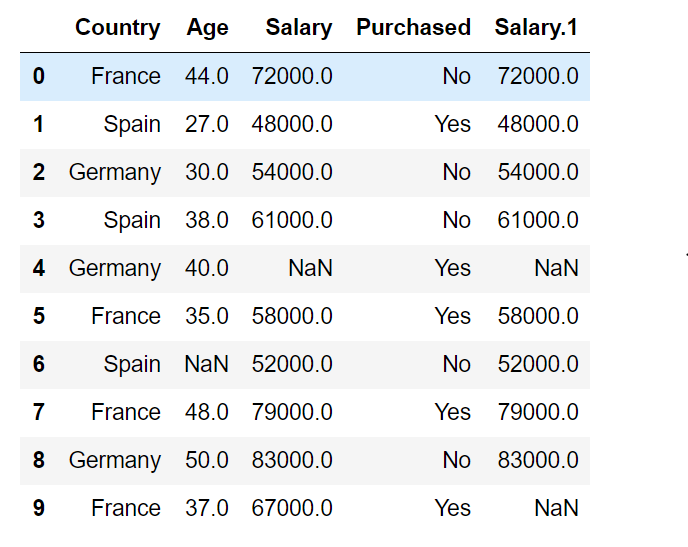
We know that the index is the feature that allows us to group our data and specifying multiple columns as the indices in pivot function increases the level of details and grouping the data.
Keeping a single index in the table:
Python3
import pandas as pd
df=pd.read_csv('GeeksForGeeks.csv')
print(pd.pivot_table(df,index=["Country"]))
|
Output:
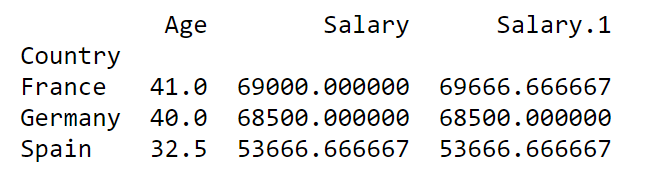
As we can see that the grouping is done country wise and the numerical data is printed as the average of all the values with regard to the specified index.
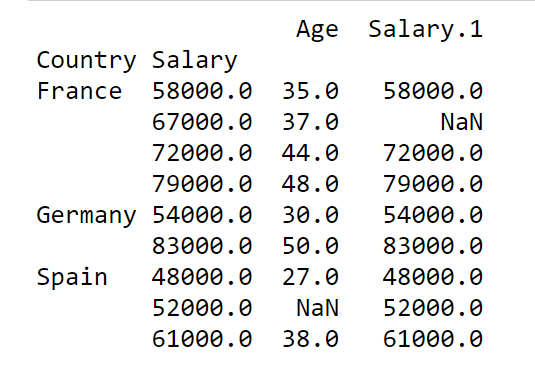
Now, Keeping multiple indices in the table:
Python3
import pandas as pd
df=pd.read_csv('GeeksForGeeks.csv')
print(pd.pivot_table(df,index=["Country","Salary"]))
|
Output:
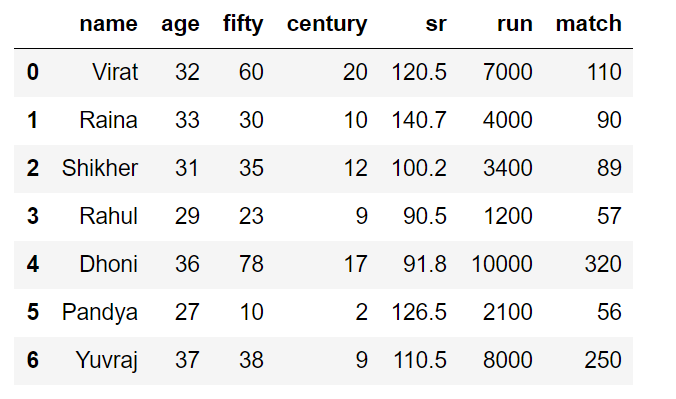
Example 2: Link to the CSV File: CSV FILE
Python3
import pandas as pd
df=pd.read_csv('GeeksForGeeks_1.csv')
df
|
Output:
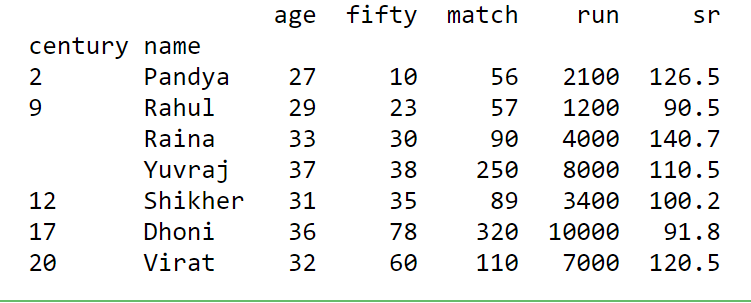
Keeping the number of centuries scored by players and their names as indices, we get:
Python3
import pandas as pd
df=pd.read_csv('dataset/new_players.csv')
print(pd.pivot_table(df,index=["century","name"]))
|
Output:
Like Article
Suggest improvement
Share your thoughts in the comments
Please Login to comment...