How to Create a Pivot Table in Python using Pandas?
Last Updated :
18 Dec, 2023
A pivot table is a statistical table that summarizes a substantial table like a big dataset. It is part of data processing. This summary in pivot tables may include mean, median, sum, or other statistical terms. Pivot tables are originally associated with MS Excel but we can create a pivot table in Pandas using Python using the Pandas Dataframe pivot_table() method.
Creating a Sample DataFrame
Let’s first create a dataframe that includes Sales of Fruits.
Python3
import pandas as pd
df = pd.DataFrame({'Product': ['Carrots', 'Broccoli', 'Banana', 'Banana',
'Beans', 'Orange', 'Broccoli', 'Banana'],
'Category': ['Vegetable', 'Vegetable', 'Fruit', 'Fruit',
'Vegetable', 'Fruit', 'Vegetable', 'Fruit'],
'Quantity': [8, 5, 3, 4, 5, 9, 11, 8],
'Amount': [270, 239, 617, 384, 626, 610, 62, 90]})
df
|
Output

Create a Pivot Table in Pandas
Below are some examples to understand how we can create a pivot table in Pandas in Python:
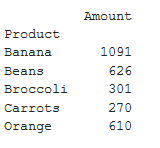
Example 1: Get the Total Sales of Each Product
In this example, the DataFrame ‘df’ is transformed using a pivot table, aggregating the total ‘Amount’ for each unique ‘Product’ and displaying the result with the sum of amounts for each product.
Python3
pivot = df.pivot_table(index=['Product'],
values=['Amount'],
aggfunc='sum')
print(pivot)
|
Output
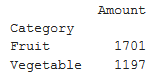
Example 2: Get the Total Sales of Each Category
In this example, a pivot table is created from the DataFrame ‘df’ to summarize the total ‘Amount’ sales for each unique ‘Category,’ employing the ‘sum’ aggregation function, and the result is printed.
Python3
pivot = df.pivot_table(index=['Category'],
values=['Amount'],
aggfunc='sum')
print(pivot)
|
Output
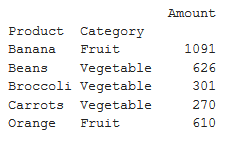
Example 3: Get Total Sales by Category and Product Both
In this example, a pivot table is generated from the DataFrame ‘df’ to showcase the total ‘Amount’ sales for unique combinations of ‘Product’ and ‘Category,’ utilizing the ‘sum’ aggregation function. The resulting pivot table is then printed.
Python3
pivot = df.pivot_table(index=['Product', 'Category'],
values=['Amount'], aggfunc='sum')
print(pivot)
|
Output
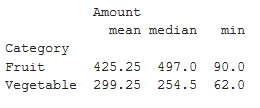
Example 4: Get the Mean, Median, Minimum Sale by Category
In this example, a pivot table is created from the DataFrame ‘df’ to display the median, mean, and minimum ‘Amount’ values categorized by ‘Category.’ The aggregation functions ‘median,’ ‘mean,’ and ‘min’ are applied, and the resulting pivot table is printed.
Python3
pivot = df.pivot_table(index=['Category'], values=['Amount'],
aggfunc={'median', 'mean', 'min'})
print(pivot)
|
Output
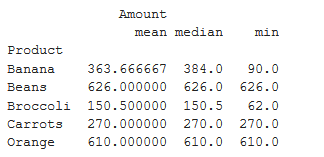
Example 5: Get the Mean, Median, Minimum Sale by Product
In this example, a pivot table is generated from the DataFrame ‘df’ to showcase the median, mean, and minimum ‘Amount’ values for each unique ‘Product.’ The aggregation functions ‘median,’ ‘mean,’ and ‘min’ are applied, resulting in the pivot table, which is then printed.
Python3
pivot = df.pivot_table(index=['Product'], values=['Amount'],
aggfunc={'median', 'mean', 'min'})
print(pivot)
|
Output
Like Article
Suggest improvement
Share your thoughts in the comments
Please Login to comment...