How to Create a Log-Log Plot in R?
Last Updated :
28 Nov, 2021
In this article, we will discuss how to create a Log-Log plot in the R Programming Language.
A log-log plot is a plot that uses logarithmic scales on both the axes i.e., the x-axis and the y-axis.We can create a Log-Log plot in the R language by following methods.
Log-Log Plot in Base R:
To create a Log-Log plot in base R we pass log(data) as data argument instead of data in the plot() function. The log() function converts the data value into its logarithmic value. The log() function by default calculates the natural logarithms. But if we need to use custom logarithmic values we can use the base parameter of the log function.
Syntax:
log( value, base )
where,
- value: a numeric variable whose logarithm is to be calculated.
- base: a numeric variable with respect to which logarithms are computed.
Example:
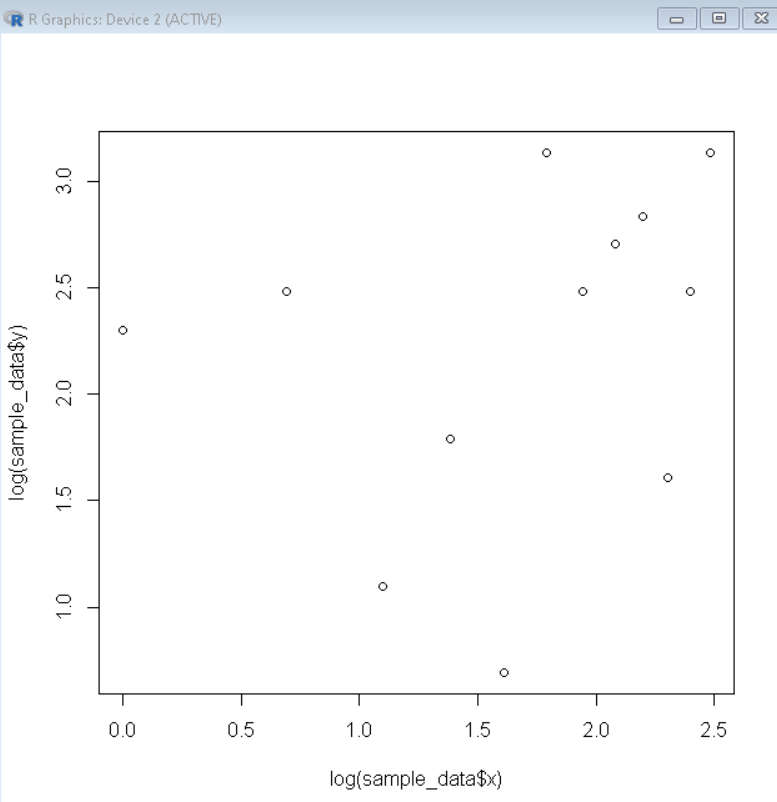
Here, is an example of a basic log-log scatter plot made using the log() function of the R Language.
R
sample_data <- data.frame(x=1:12,
y=c(10, 12, 3, 6, 2, 23, 12,
15, 17, 5, 12, 23))
plot( log(sample_data$x), log(sample_data$y) )
|
Output:
Log-Log Plot using ggplot2
To create a Log-Log plot in the ggplot2. We convert the data frame values to their logarithmic values by using the log() function. The log() function converts the data value into its logarithmic value. Then we pass the converted data frame as an argument to the ggplot() function and use the geom_point() function to draw a scatter plot.
Syntax:
plot_dataframe <- data.frame( x= log(df$x), y= log(df$y) )
ggplot( plot_dataframe, aes( x, y) ) + geom_point() + labs ( title )
where,
- df: determines the data frame that is to be plotted..
- title: determines the title of plot.
Example:
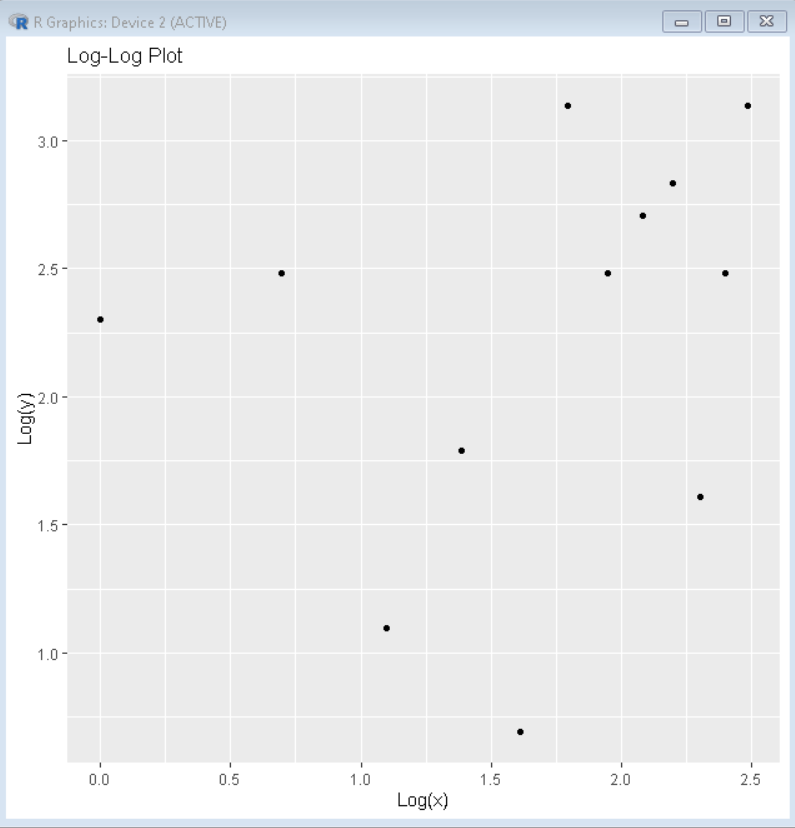
Here, is an example of a basic log-log plot made using the ggplot2 package of the R Language.
R
library(ggplot2)
sample_data <- data.frame(x=1:12,
y=c(10, 12, 3, 6, 2, 23, 12,
15, 17, 5, 12, 23))
plot_data <- data.frame( x=log(sample_data$x), y=log(sample_data$y) )
ggplot(plot_data, aes(x=x, y=y)) +
geom_point()+
labs(title='Log-Log Plot', x='Log(x)', y='Log(y)')
|
Output:
Like Article
Suggest improvement
Share your thoughts in the comments
Please Login to comment...