How to Create a Grouped Barplot in R?
Last Updated :
19 Dec, 2021
In this article, we will discuss how to create a grouped barplot in the R programming language.
Method 1: Creating A Grouped Barplot In Base R
In this method of creating a grouped barplot, the user needs just use the base functionalities of the R language. The user needs to first modify the data used to create the bar charts accordingly into different groups and then has to call the barplot() function with the required parameters passed into it to create the barplot of the given data respectively in the R programming language.
Barplot() function: This function is used to create a bar plot with vertical or horizontal bars.
Syntax: barplot(height, beside = FALSE,… )
Parameters:
- height: either a vector or matrix of values describing the bars which make up the plot. I
- beside: a logical value. If FALSE, the columns of height are portrayed as stacked bars, and if TRUE the columns are portrayed as juxtaposed bars.
- …: arguments to be passed to/from other methods.
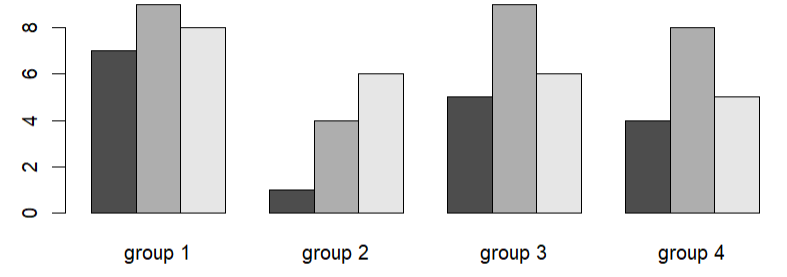
Example: In this example, we will be creating the grouped barplot of four different groups in the base R.
R
gfg <- data.frame(x = c(7,9,8,1,4,6,5,9,6,4,8,5),
grp = rep(c("group 1", "group 2",
"group 3","group 4"),
each = 3),
subgroup = LETTERS[1:3])
gfg <- reshape(gfg,idvar = "subgroup",
timevar = "grp",
direction = "wide")
row.names(gfg) <- gfg$subgroup
gfg <- gfg[ , 2:ncol(gfg)]
colnames(gfg) <- c("group 1", "group 2",
"group 3","group 4")
gfg <- as.matrix(gfg)
barplot(height = gfg,beside = TRUE)
|
Output:
Method 2: Creating A Grouped Barplot Using ggplot2 Package
In this approach to create a group barplot, the user first needs to install and import the ggplot2 package in the working r console, here the ggplot2 is responsible for importing its functions which are in use to create the grouped barplot. Then the user needs to call the geom_bar() function from the ggplot package with the required parameters into it to create the grouped bar plot in the R programming language.
Syntax to install & import the ggplot package in the working R console:
install.package('ggplot2') #To Install
library(ggplot2)           #To Import
geom_bar() function: This function makes the height of the bar proportional to the number of cases in each group.
Syntax: geom_bar( mapping = NULL, data = NULL, stat = “count”, position = “stack”, …,)
Parameters:
- mapping: Set of aesthetic mappings created by aes() or aes_(). If specified and inherit.aes = TRUE (the default), it is combined with the default mapping at the top level of the plot.
- data: The data to be displayed in this layer.
- position: Position adjustment, either as a string, or the result of a call to a position adjustment function.
- stat: Override the default connection.
- …: Other arguments passed.
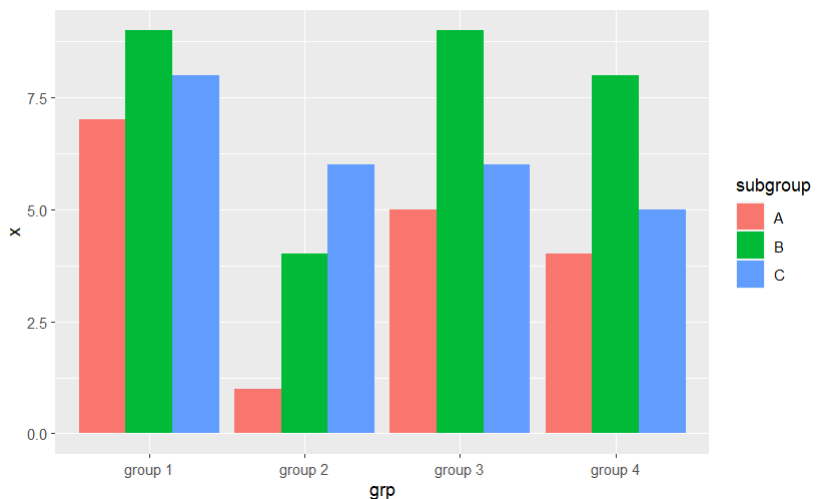
Example:
R
library(ggplot2)
gfg <- data.frame(x = c(7,9,8,1,4,6,5,9,6,4,8,5),
grp = rep(c("group 1", "group 2",
"group 3","group 4"),
each = 3),
subgroup = LETTERS[1:3])
ggplot(gfg,aes(x = grp, y =x, fill = subgroup)) +
geom_bar(stat = "identity", position = "dodge")
|
Output:
Method 3: Creating A Grouped Barplot Using lattice Package
In this approach to create a grouped barplot, the user first needs to install and import the lattice package in the working R console, then the user needs to call the barchart() function from the lattice package and pass this function with the respective parameters into it to get the grouped barplot in the R programming language.
Syntax to install & import the lattice package in the working R console:
install.package('lattice ') #To Install
library(lattice)           #To Import
Barchart: This function is used to draw bar plots.
Syntax: barchart(formula, data = parent.frame(), panel = panel.barchart, box.ratio =2, …)
Parameters:
- formula: a formula describing the form of the conditioning plot. A formula of the form y ~ x | g1 * g2 * … indicates that plots of y versus x should be produced conditional on the variable g1,g2,….
- panel: panel function to be used to draw panels
- data: data frame for the variables in the formula etc
- box.ratio: ratio of bar width to inter bar width
- …: other arguments
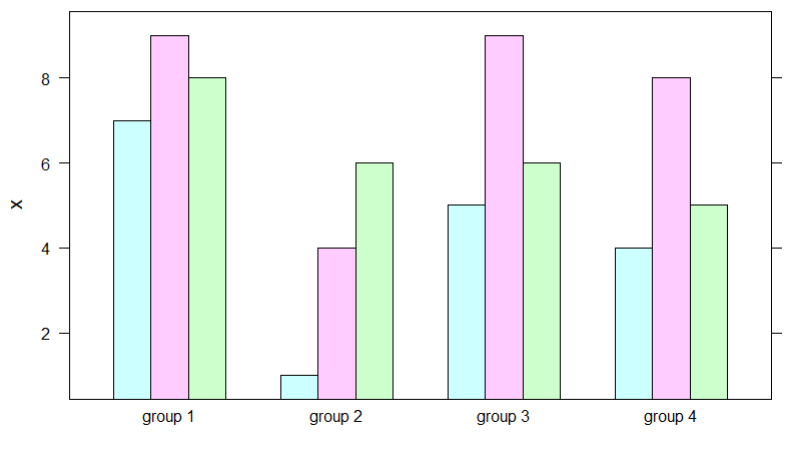
Example: In this example, we will be creating a grouped barplot using the barchart() function from the lattice package in the R programming language.
R
library(lattice)
gfg <- data.frame(x = c(7,9,8,1,4,6,5,9,6,4,8,5),
grp = rep(c("group 1", "group 2",
"group 3","group 4"),
each = 3),
subgroup = LETTERS[1:3])
barchart(x ~ grp, data = gfg, groups = subgroup)
|
Output:
Like Article
Suggest improvement
Share your thoughts in the comments
Please Login to comment...