How to Create a Bell Curve in Excel?
Last Updated :
07 Mar, 2022
A bell curve represents a normal/gaussian distribution. The data in a gaussian distribution is centered around the mean. A Gaussian distribution is said to be a standard normal distribution when it has its mean as 0 and standard deviation as 1. A bell curve is generally symmetrical about the y-axis. The orientation of the bell curve can be manipulated by making changes in the mean and standard deviation of the distribution. When we change the mean, it can cause the location of the curve to shift on the X-axis whereas when we change the standard deviation it causes a change in the shape of the bell curve. The lesser value of standard deviation implies that our data is more concentrated about the mean and the curve will be taller in shape on the Y-axis and it will be less spread on the X-axis.
In a standard normal distribution, mean, median, and mode are the same. The area under the bell curve represents the probability and the sum of the entire area equals 1. The points on the curve closer to the mean have a higher probability of occurrence and as we move sidewards towards the tails of the curve the probability of occurrence decreases.
The Gaussian distribution is one of the most common distributions that exist in our world. It can be found naturally in many cases such as the distribution of height of human beings, the average salary earned by working professionals, etc. In this article, we are going to learn how can we plot a bell curve in Excel.
Bell Curve in Excel
Suppose, we have salary data of 20 employees working in a company and we want to plot their salaries onto a bell curve. To plot a bell curve in Excel, we need to have a normal distribution for our data which we can calculate using the NORM.DIST() function that is available in Excel. The syntax for NORM.DIST() function is given as:
=NORM.DIST(x, mean, standard_dev, Cumulative)
Where x is the data array
Mean is the Mean value of the entire distribution, standard_dev is the Standard Deviation of the distribution, Cumulative is a boolean value which is either TRUE or FALSE, if we want a cumulative distribution function we use TRUE. Else if we want probability mass function then we use FALSE as the boolean value.
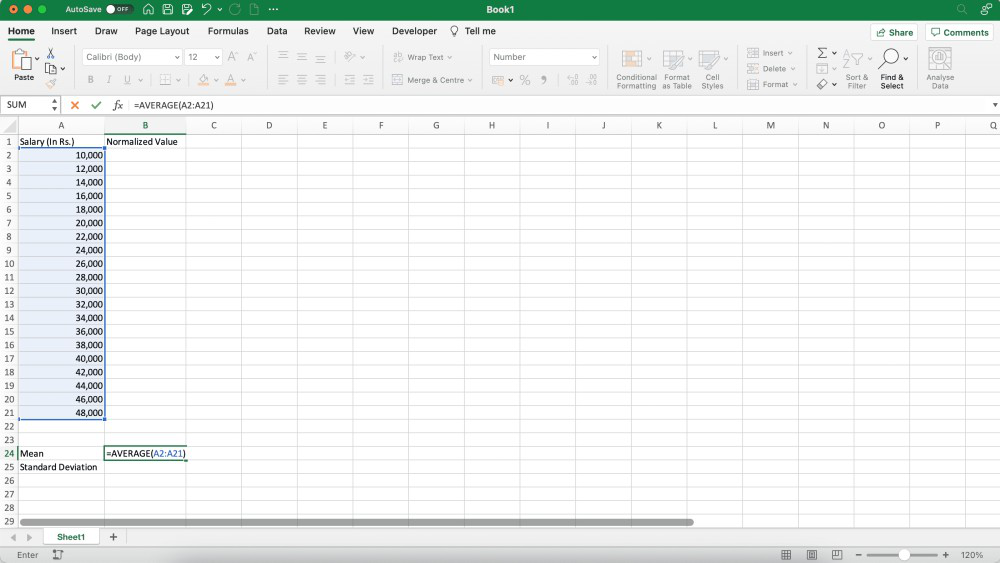
Step 1: We need the mean of the distribution as one of the parameters inside the NORM.DIST() function, therefore we will calculate the mean using the AVERAGE() function available in Excel.
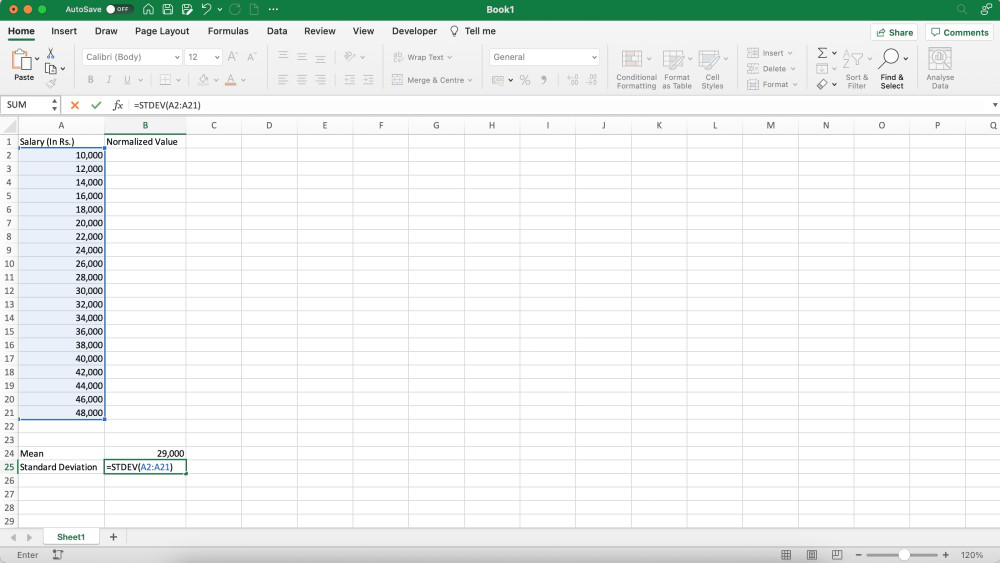
Step 2: Another parameter that we require is the standard deviation of the distribution, we can calculate standard deviation using the STDEV() function available in Excel.
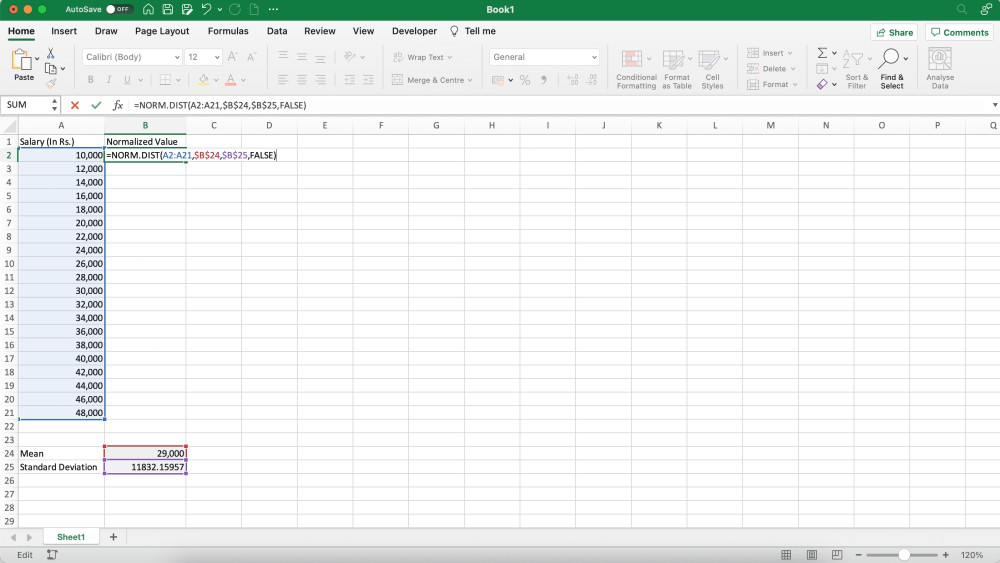
Step 3: Use the NORM.DIST() function to find the normal distribution for the data. We can pass the entire data array as our first parameter, then mean and standard deviation, and at last as we are going to use the salary of employees, all the values will be continuous, hence we will use probability mass function, therefore, we will pass FALSE as the boolean_value.
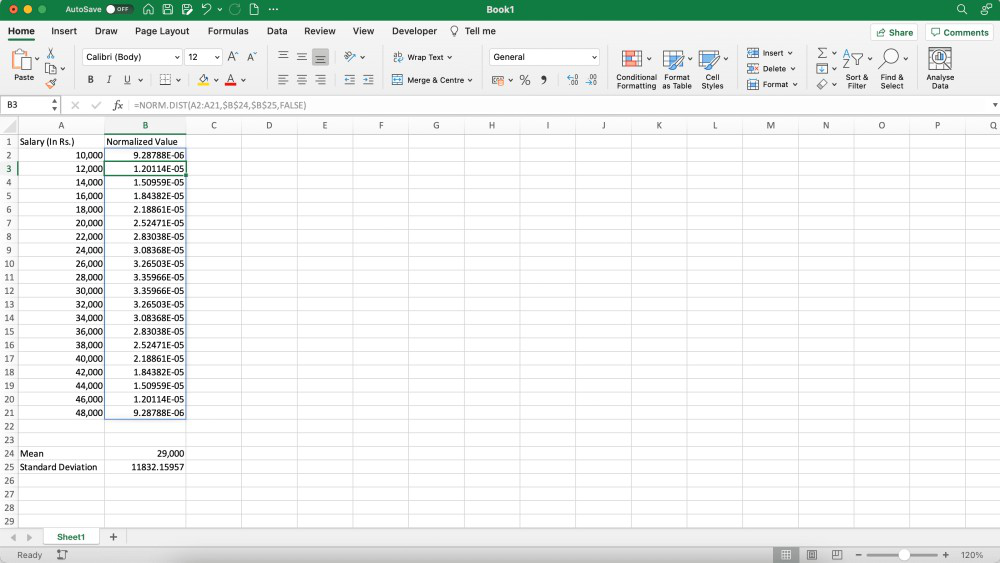
Step 4: Normal distribution will get populated for all the elements in the data.
Step 5: Now, select all the generated points and go to the Insert tab in the Menu bar.
Step 6: In the Insert tab, click on the Scatter plot button, a drop-down will appear.
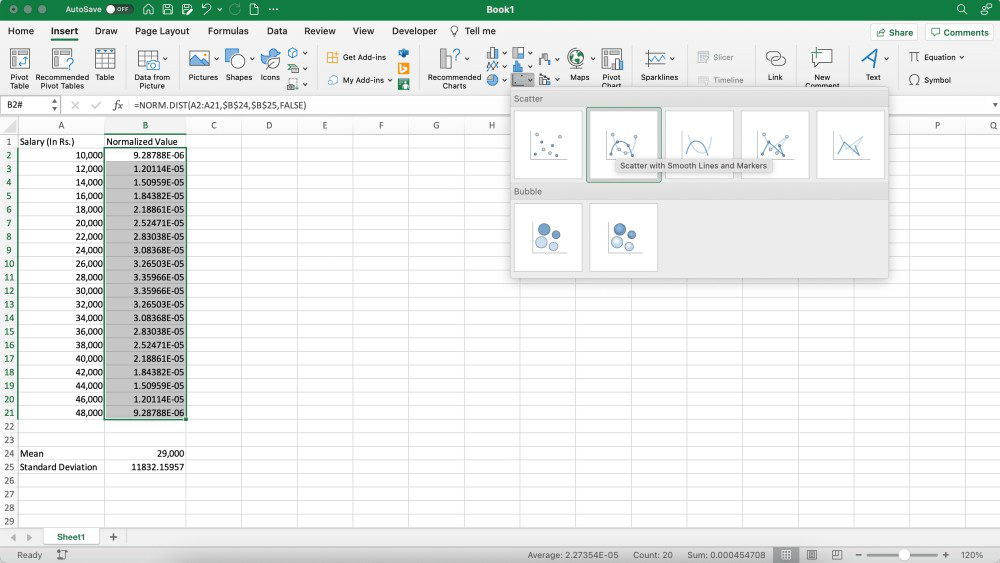
Step 7: From the drop-down options, select either the “Scatter with smooth lines and markers” option or the “Scatter with smooth lines” option.
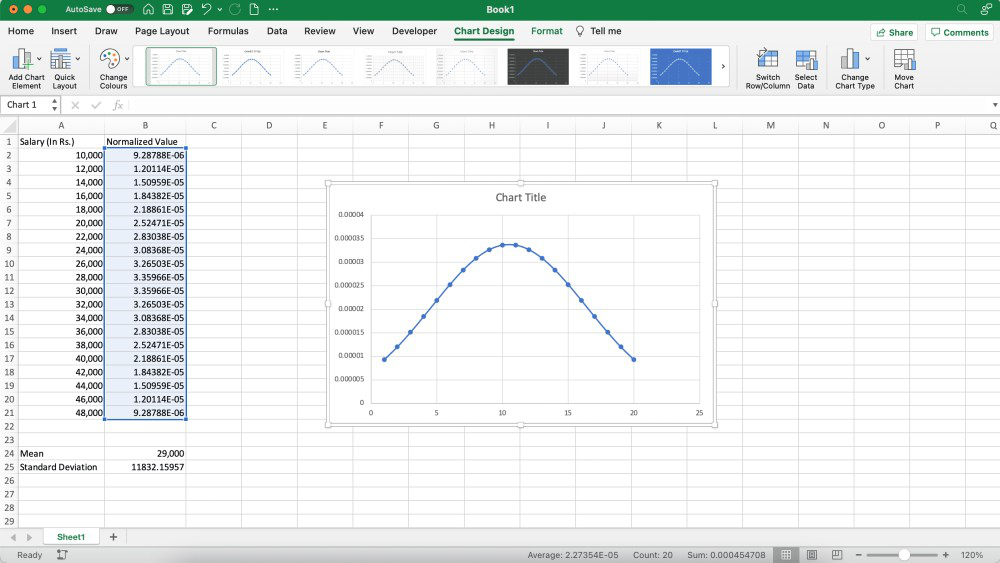
Step 8: A scatter plot with a bell-shaped curve will be plotted on the worksheet.
Note: Make sure to reference lock the values of Mean and Standard Deviation in the parameters using the Fn+F4 key inside the NORM.DIST() function, otherwise the formula will throw an error and will not populate the result for all the data elements.
Like Article
Suggest improvement
Share your thoughts in the comments
Please Login to comment...