How to Count the Number of Circles in Given Digital Image Using MATLAB?
Last Updated :
06 Mar, 2022
In image processing, connected component analysis is the technique to count and inspect the segments automatically. Let suppose, we have an image consisting of small circles. There are hundreds of circles in the image. We need to count the number of circles. It will take a lot of time if we count manually, and still, the result may not be correct. On the other hand, we can use connected component analysis to count the number easily and accurately.
A necessary condition is that the segments or shapes which we are interested to count should be disconnected from each other. Two circles connected by one common pixel will be counted as 1. Thus, the primary and essential condition is that each shape must be separated.
Steps:
- Read the input image.
- Convert color image into grayscale.
- Create a disk-shaped structuring element.
- Perform erosion of the image using structuring elements.
- Apply connected component analysis and label the components.
- Count the labels.
- Show the results.
Functions Used:
- imread( ) inbuilt function is used to read the image.
- rgb2gray( ) inbuilt function is used to convert RGB image into grayscale image.
- strel( ) inbuilt function is used to define structuring element.
- imerode( ) inbuilt function is used to perform erosion.
- bwlabel( ) inbuilt function is used to apply connected component analysis.
- imtool( ) inbuilt function is used to display the image.
- max( ) inbuilt function is used to find maximum among all values.
Example:
Matlab
k=imread("CCA1.png");
k=rgb2gray(k);
SE=strel('disk',9,0);
k1=imerode(k,SE);
imtool(k1);
b=bwlabel(k1,8);
c=unique(b);
max(c);
imtool(b,[]);
|
Output: max=20 Therefore, there are 20 circles in the input image.
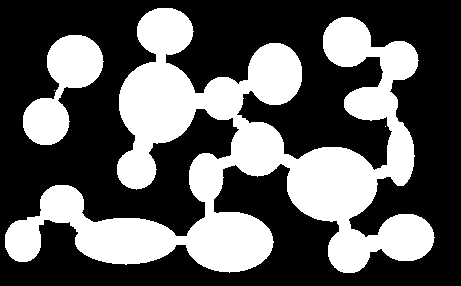
Figure 1: Original image
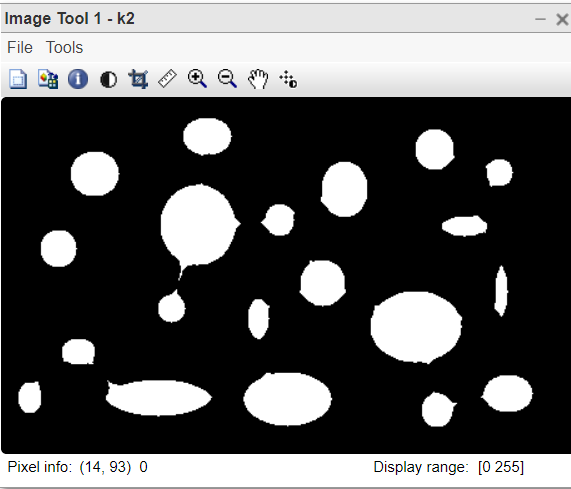
Figure 2: Eroded image
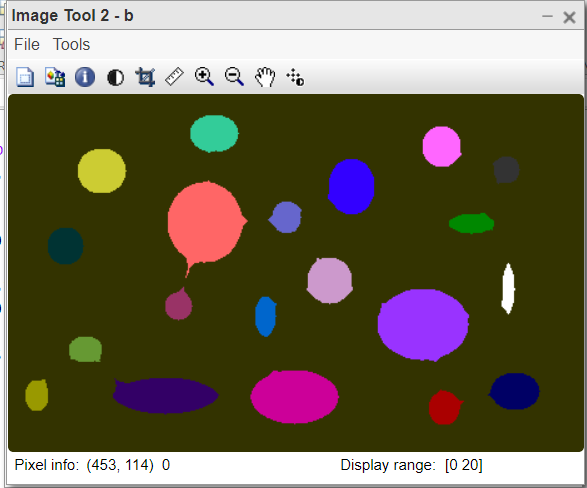
Figure 3: Labelled image colour cube
Code Explanation:
- k=rgb2gray(k); This line converts colour image into grayscale.
- SE=strel(‘disk’,9,0); This line defines the structuring element.
- k1=imerode(k,SE); This line will compute eroded image.
- b=bwlabel(k1,8); This line will apply connected component analysis.
- max(c); This line will count the number of circles in the image.
Example 2:
Matlab
k=imread("7.jpg");
k1=imresize(k,0.3);
k1=rgb2gray(k1);
imtool(k1,[]);
k2=im2bw(k1,graythresh(k1));
imtool(k2,[]);
k3=1-k2;
imtool(k3,[]);
b=bwlabel(k3,8);
c = unique(b);
max(c)
imtool(b,[]);
|
Output: max = 629, Therefore, there are 629 holes in the beehive.
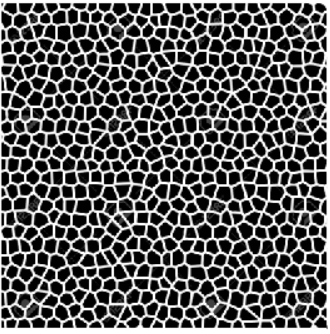
Figure 4: Original image
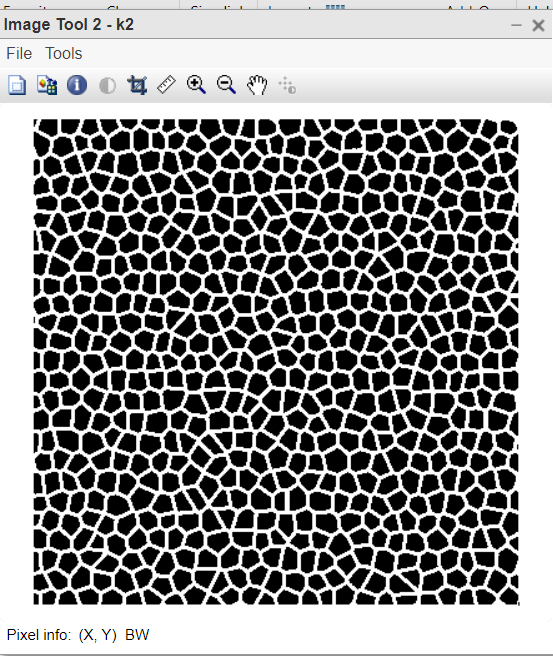
Figure 5: Binary image: Bricks are black
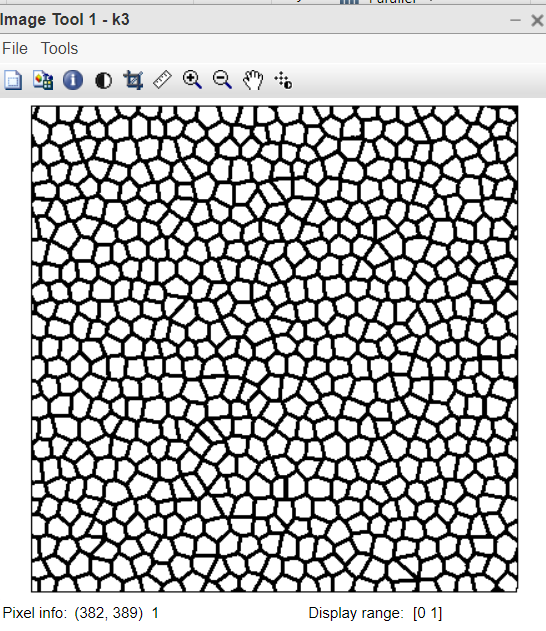
Figure 6: Binary image: Bricks are white
Code Explanation:
- k1=rgb2gray(k1); This line converts color image into grayscale.
- k2=im2bw(k1,graythresh(k1)); This line converts grayscale into binary image.
- b=bwlabel(k3,8); This line applies connected component analysis.
- c=unique(b); This line finds the unique labels.
- max(c); This line finds the max value.
- imtool(b,[]); This line displays the colored map image.
Like Article
Suggest improvement
Share your thoughts in the comments
Please Login to comment...