How to Change the Number of Ticks in Matplotlib?
Last Updated :
28 Nov, 2021
In this article, we will see how to change the number of ticks on the plots in matplotlib in Python.
xticks() and yticks() is the function that lets us customize the x ticks and y ticks by giving the values as a list, and we can also give labels for the ticks, matters, and as **kwargs we can apply text effects on the tick labels.
Syntax: matplotlib.pyplot.xticks(ticks=None, labels=None, **kwargs)
Parameter:
- ticks – The list of x ticks.
- labels – The list of tick labels
- kwargs – Text effects on labels
Returns:
- locs – The list of x ticks.
- labels – The list of tick text labels
Example:
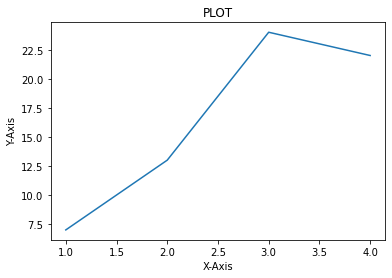
In this example, we will use the ‘inline’ backend. Matplotlib graphs will be included in the notebook, next to the code. Then we give the x and y values to plot and take simple values because it would be easier to catch the concept. We are providing the title, x-label, y-label to show in the plot.
Python3
import pandas as pd
import numpy as np
from matplotlib import pyplot as plt
x = [1, 2, 3, 4]
y = [7, 13, 24, 22]
plt.plot(x, y)
plt.title("PLOT")
plt.xlabel("X-Axis")
plt.ylabel("Y-Axis")
plt.show()
|
Output:
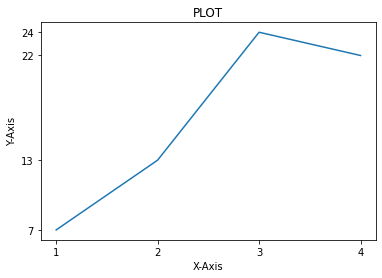
Now, we want only four ticks on both x and y-axis; we need to mention the ticks we need as a list with the xticks() and yticks() function. So In this code, we establish the same steps to plot. and then using xticks(), function we are mentioning the values(1,2,3,4) and by yticks() we are mentioning values (7,13,24,22). The same number of ticks is displayed in the output.
Python3
x = [1, 2, 3, 4]
y = [7, 13, 24, 22]
plt.plot(x, y)
plt.title("PLOT")
plt.xlabel("X-Axis")
plt.ylabel("Y-Axis")
plt.xticks([1, 2, 3, 4])
plt.yticks([7, 13, 24, 22])
plt.show()
|
Output:
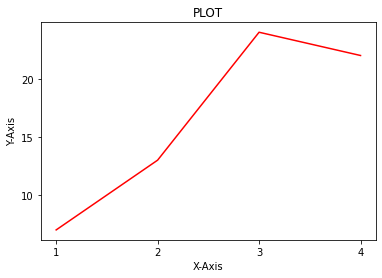
Locator_params() function that lets us change the tightness and number of ticks in the plots. This is made for customizing the subplots in matplotlib, where we need the ticks packed a little tighter and limited. So, we can use this function to control the number of ticks on the plots.
syntax: matplotlib.pyplot.locator_params(axis=’both’, tight=None, nbins=None **kwargs)
Parameter:
- axis – The axis we need to change the number of ticks or tighten them.
- tight – Takes in a bool value weather the ticks should be tightened or not
- nbins – number of ticks we should have in the axis.
Now, we are going to limit the number of ticks on both axes by 4
Example:
In this example, we are implementing the same steps to make a plot, and we want only four ticks on both sides. We can call the locate_params() function and mention the axis, which is both x and y-axis, and pass in a parameter called nbins to mention the number of ticks we want on each axis.
Python3
x = [1, 2, 3, 4]
y = [7, 13, 24, 22]
plt.plot(x, y, color='Red')
plt.title("PLOT")
plt.xlabel("X-Axis")
plt.ylabel("Y-Axis")
plt.locator_params(axis='both', nbins=4)
plt.show()
|
Output:
Method 3: Using xlim()
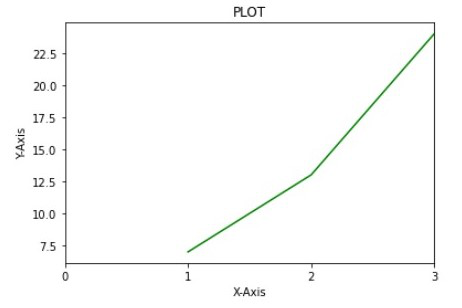
Using this locate_params() function, no matter how many bins we mention, we will always show the whole plot regardless of the number. Still, if we want only the first three values of the x-axis to visualize, you can use this xlim() and ylim() function to set a limit for the x-axis and y-axis of the plot and then use the locate param to reduce the number of ticks.
Note: If you forget to use the locate_param after this function will not reduce the number of ticks it will still show all the unwanted ticks on your plot. So, make sure you use locate_params() function after this function
Syntax:
matplotlib.pyplot.xlim(*args, **kwargs)
Now, we are going to try and reduce the number of ticks on the x-axis and try to visualize only the first three values of the plot.
Example:
Like the previous example, we are using locate_params() to limit the number of ticks, but before that, we will restrict the number of ticks we have to visualize from the start to end as a tuple.
Python3
x = [1, 2, 3, 4]
y = [7, 13, 24, 22]
plt.plot(x, y)
plt.title("PLOT")
plt.xlabel("X-Axis")
plt.ylabel("Y-Axis")
plt.xlim(0, 3)
plt.locator_params(axis='x', nbins=3)
plt.show()
|
Output:
Like Article
Suggest improvement
Share your thoughts in the comments
Please Login to comment...