How to Change Position of ggplot Title in R ?
Last Updated :
20 Mar, 2023
In this article, we will discuss how to change the position of title in a plot using ggplot in R Programming Language. ggtitle() function can be used to give an appropriate title to a plot.
Syntax:
ggtitle("title")
By Default the title is left aligned. Thus, if the requirement is a left-aligned title nothing much has to be done.
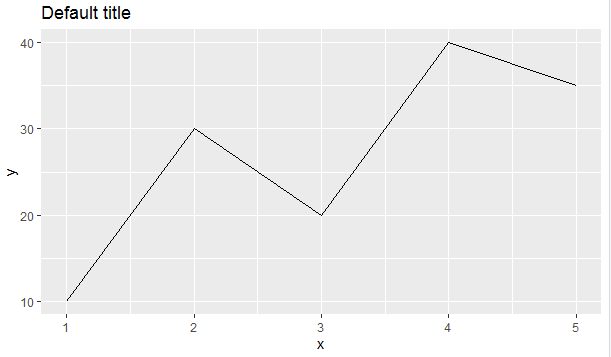
Example:
R
library("ggplot2")
x<-c(1,2,3,4,5)
y<-c(10,30,20,40,35)
df<-data.frame(x,y)
ggplot(df,aes(x,y))+geom_line()+
ggtitle("Default title")
|
Output:
To display the title at any other position of the plot use theme() function. Within theme() function use plot.title parameter with element_text() function as value to it. Again within this function pass the value for hjust attribute.
Syntax:
theme(plot.title=element_text(hjust=value))
To get the title at the center the value of hjust should be assigned to 0.5.
Example:
R
library("ggplot2")
x<-c(1,2,3,4,5)
y<-c(10,30,20,40,35)
df<-data.frame(x,y)
ggplot(df,aes(x,y))+geom_line()+
ggtitle("Title at center")+
theme(plot.title = element_text(hjust=0.5))
|
Output

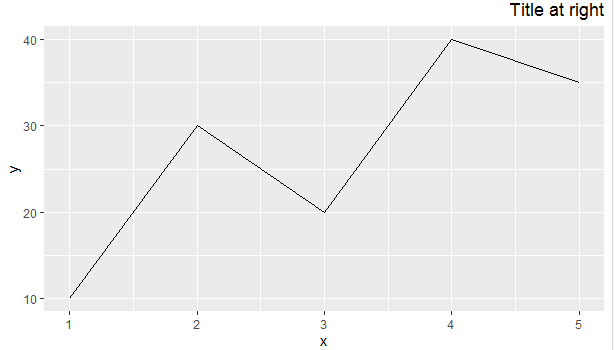
To display title at the right, hjust should be assigned 1 as value.
Example:
R
library("ggplot2")
x<-c(1,2,3,4,5)
y<-c(10,30,20,40,35)
df<-data.frame(x,y)
ggplot(df,aes(x,y))+geom_line()+ggtitle("Title at right")+
theme(plot.title = element_text(hjust=1))
|
Output:
Share your thoughts in the comments
Please Login to comment...