How to Change Order of Items in Matplotlib Legend?
Last Updated :
19 Dec, 2021
Legend is a method present in the Matplotlib package which represents the area to describe the elements in a plot/graph.
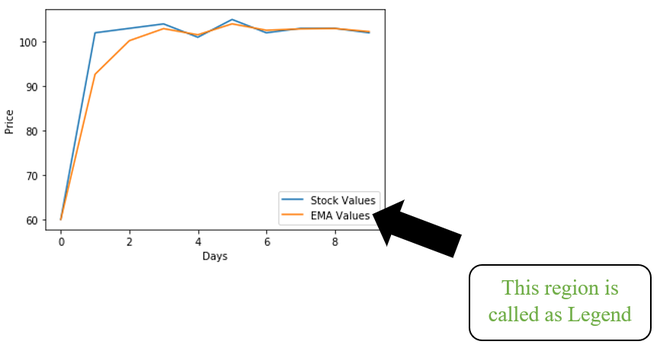
The order of labels in the legend region was based on the order we add the lines(data) to the plot.
Example:
Let us consider a DataFrame that stores student marks in weekly tests.
|
|
Raju
|
Hari
|
Bablu
|
Dora
|
|
Test-1
|
8
|
6
|
9
|
10
|
|
Test-2
|
10
|
4
|
9
|
9
|
|
Test-3
|
7
|
6
|
9
|
10
|
|
Test-4
|
7
|
7
|
9
|
9
|
|
Test-5
|
10
|
6
|
9
|
10
|
The above table stores the 4 student marks in 5 tests. Now plot the graph with legend using the above data.
Python3
import pandas as pd
import matplotlib.pyplot as plt
Marks = pd.DataFrame({'Raju': [8, 10, 7, 7, 10],
'Hari': [6, 4, 6, 7, 6],
'Bablu': [9, 9, 9, 9, 9],
'Dora': [10, 9, 10, 9, 10]})
plt.plot(Marks['Raju'], label="Raju Marks", color="Red")
plt.plot(Marks['Hari'], label="Hari Marks", color="Blue")
plt.plot(Marks['Bablu'], label="Bablu Marks", color="Yellow")
plt.plot(Marks['Dora'], label="Dora Marks", color="Black")
plt.xlabel("Tests")
plt.ylabel("Marks")
plt.legend()
plt.show()
|
Output
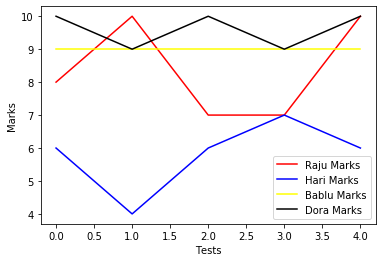
Change order of items in the legend
The above order of elements in the legend region can be changed by the gca method that uses another sub-method called get_legend_handles_labels method.
Syntax
handles, labels = plt.gca().get_legend_handles_labels()
These handles and labels lists are passed as parameters to legend method with order of indexes.
Consider the below example code for detailed understanding.
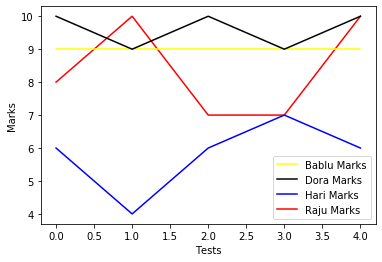
Example 1:
In this code, we used the same DataFrame we used in the above code. But used the above-specified methods to change the order of elements in the legend region.
Python3
import pandas as pd
import matplotlib.pyplot as plt
Marks = pd.DataFrame({'Raju': [8, 10, 7, 7, 10],
'Hari': [6, 4, 6, 7, 6],
'Bablu': [9, 9, 9, 9, 9],
'Dora': [10, 9, 10, 9, 10]})
plt.plot(Marks['Raju'], label="Raju Marks", color="Red")
plt.plot(Marks['Hari'], label="Hari Marks", color="Blue")
plt.plot(Marks['Bablu'], label="Bablu Marks", color="Yellow")
plt.plot(Marks['Dora'], label="Dora Marks", color="Black")
plt.xlabel("Tests")
plt.ylabel("Marks")
handles, labels = plt.gca().get_legend_handles_labels()
order = [2, 3, 1, 0]
plt.legend([handles[i] for i in order], [labels[i] for i in order])
plt.show()
|
Output
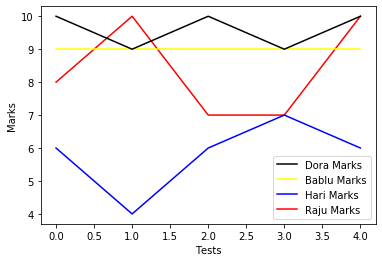
Example 2:
Below is the implementation of plotting a graph that represents student marks along with legend with specified order in legend region.
Python3
import pandas as pd
import matplotlib.pyplot as plt
Marks = pd.DataFrame({'Raju': [8, 10, 7, 7, 10],
'Hari': [6, 4, 6, 7, 6],
'Bablu': [9, 9, 9, 9, 9],
'Dora': [10, 9, 10, 9, 10]})
plt.plot(Marks['Raju'], label="Raju Marks", color="Red")
plt.plot(Marks['Hari'], label="Hari Marks", color="Blue")
plt.plot(Marks['Bablu'], label="Bablu Marks", color="Yellow")
plt.plot(Marks['Dora'], label="Dora Marks", color="Black")
plt.xlabel("Tests")
plt.ylabel("Marks")
handles, labels = plt.gca().get_legend_handles_labels()
order = [3, 2, 1, 0]
plt.legend([handles[i] for i in order], [labels[i] for i in order])
plt.show()
|
Output
Like Article
Suggest improvement
Share your thoughts in the comments
Please Login to comment...