How to Change Number of Bins in Histogram in R?
Last Updated :
19 Dec, 2021
In this article, we will discuss how to change the number of bins in the histogram in the R Programming Language.
A Histogram is a variation of a bar chart in which data values are grouped together and put into different classes. This grouping enables us to see how frequently data in each class occur in the dataset. While grouping the data into classes sometimes we want to set a specific number of bins to divide the histogram into the desired number of bars. To do so in the R Language, we use the following methods:
Method 1: Changing number of bins in the histogram in base R
To change the number of bins in the histogram in Base R Language, we use the breaks argument of the hist() function. The breaks argument of the hist function to increase or decrease the width of our bars by fixing the number of bars, cells, or bins the whole histogram will be divided into. By default breaks is equal to “Sturges”.
Syntax: hist( data_vector, breaks )
where,
- data_vector: determines the data vector to be plotted.
- breaks: determines the number of bars, cells, or bins for the histogram.
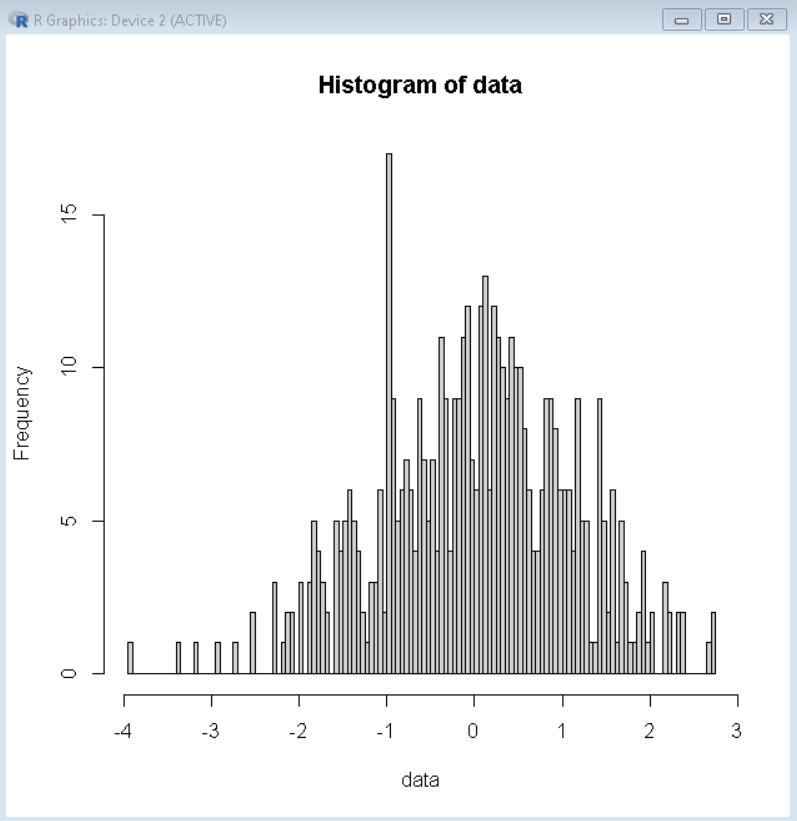
Example: Here, is a basic histogram with 100 bars made using the breaks argument of the hist() function.
R
data <- rnorm(500)
hist( data, breaks=100 )
|
Output:
Method 2: Changing the number of bins in the histogram in ggplot2
To change the number of bins in the histogram using the ggplot2 package library in the R Language, we use the bins argument of the geom_histogram() function. The bins argument of the geom_histogram() function to manually set the number of bars, cells, or bins the whole histogram will be divided into. By default, stat_bin uses 30 bins.
Syntax: ggplot(df, aes(x) ) + geom_histogram( bins )
where,
- df: determines the data frame to be plotted.
- x: determines the x-axis variable.
- bins: determines the number of bars, cells, or bins for the histogram.
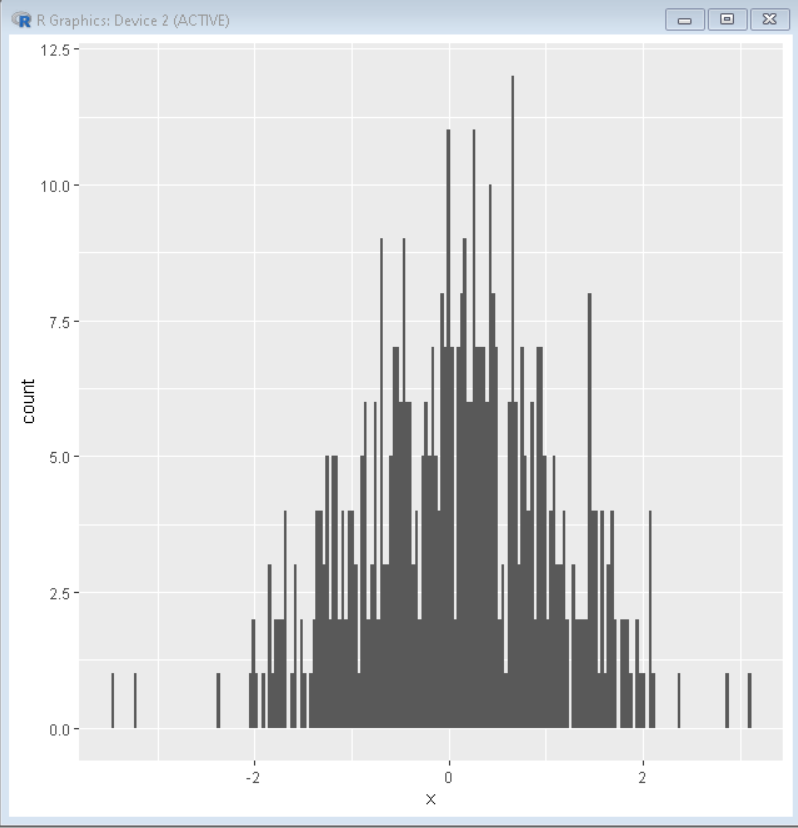
Example: Here, is a basic histogram with 200 bars made using the bins argument of the geom_histogram() function.
R
data_frame <- data.frame( x=rnorm(500) )
library(ggplot2)
ggplot( data_frame, aes( x= x ) ) +
geom_histogram( bins=200 )
|
Output:
Like Article
Suggest improvement
Share your thoughts in the comments
Please Login to comment...