How to Change Axis Intervals in R Plots?
Last Updated :
19 Dec, 2021
In this article, we will be looking at the different approaches to change axis intervals in the R programming language.
Method 1: Using xlim() and ylim() functions in base R
In this method of changing the axis intervals, the user needs to call the xlim() and ylim() functions, passing the arguments of the range of the axis intervals required by the user in form of the vector, this will be changing the axis intervals of the plot as per the specified parameters by the user in the R programming language.
xlim() and ylim() functions are used to limit the x-axis and the y-axis.
Syntax:
xlim(…)
ylim(…)
Parameters:
…: If numeric, will create a continuous scale, if factor or character, will create a discrete scale.
Syntax:
barplot(data,xlim=c(),ylim=c())
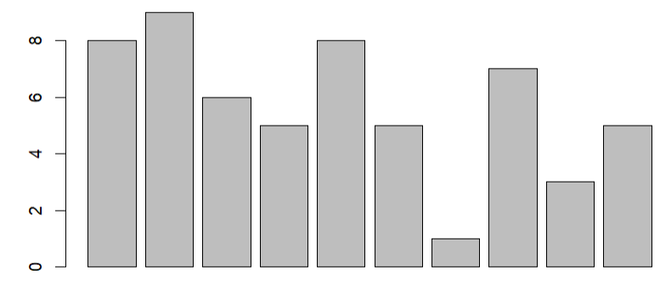
Example: Initial plot
R
gfg<-c(8,9,6,5,8,5,1,7,3,5)
barplot(gfg)
|
Output:
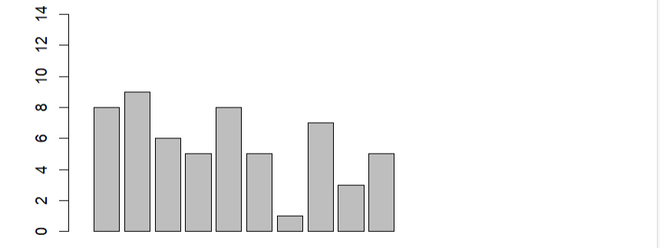
Example: Change axis intervals
R
gfg<-c(8,9,6,5,8,5,1,7,3,5)
barplot(gfg,xlim=c(0,20), ylim=c(0,15))
|
Output:
Method 2: Using log argument in base R
In this method to change the axis intervals of the given plot, the user needs to use the log arguments with the plot function to transform one of the axes into a log scale, this will be changing the axis defined by the user to the logarithm axis in the R programming language.
Syntax:
barplot(data,log='x/y')
Example: Initial plot
R
gfg<-c(8,9,6,5,8,5,1,7,3,5)
barplot(gfg)
|
Output:
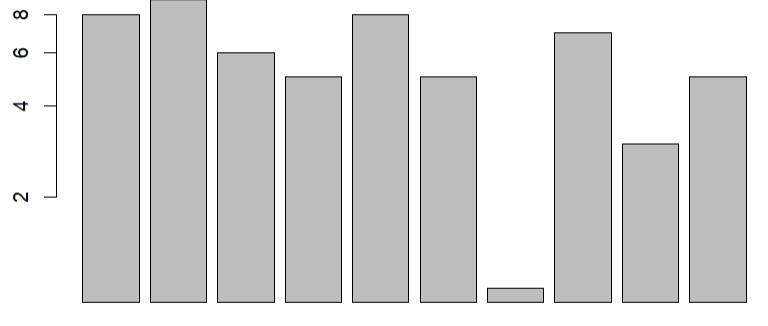
Example: Change axis intervals
R
gfg<-c(8,9,6,5,8,5,1,7,3,5)
barplot(gfg,log='y')
|
Output:
Method 3: Using xlim() and ylim() functions with ggplot2
In this approach to change the axis intervals of the given plot, the user needs to install and import the ggplot2 package in the working console of the R programming language, here the ggplot2 package is responsible for creating the plots, then the user needs to call the xlim() and the ylim() function with the required parameters as per the user to change the axis intervals as required by the user, these functions will be called with the plot created with ggplot2 and this will be leading to the change in the plot axis intervals as defined by the users.
Example: Initial plot
R
gfg<-c(8,9,6,5,8,5,1,7,3,5)
barplot(gfg)
|
Output:
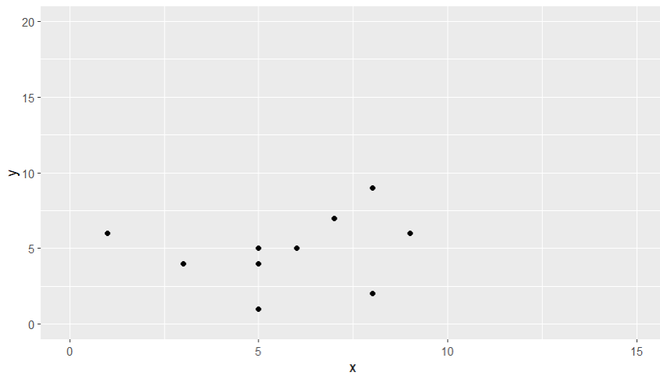
Example: Change axis intervals
R
library(ggplot2)
gfg<-data.frame(x=c(8,9,6,5,8,5,1,7,3,5),
y=c(9,6,5,4,2,5,6,7,4,1))
ggplot(data=gfg,aes(x=x, y=y)) + geom_point()+
xlim(0,15)+ylim(0,20)
|
Output:
Method 4:Using scale_x_continuous() and scale_y_continuous() functions with ggplot2
In this method to change the axis interval, the user needs to install and import the ggplot2 package in the working R console, this package will be responsible for the plotting of the plot and for using some of the functionality. Then the user needs to call the scale_x_continous() /scale_x_continous() function with the plotted ggplot2 plot with the required parameters to change the axis intervals to a log scale in the R programming language.
scale_x_continuous() / scale_y_continuous() functions are used to for continuous position scales (x & y).
Syntax:
scale_x_continuous(…, expand = waiver())
scale_y_continuous(…, expand = waiver())
Parameters:
- …: common continuous scale parameters: name, breaks, labels, na.value, limits and trans.
- expand: a numeric vector of length two giving multiplicative and additive expansion constants.
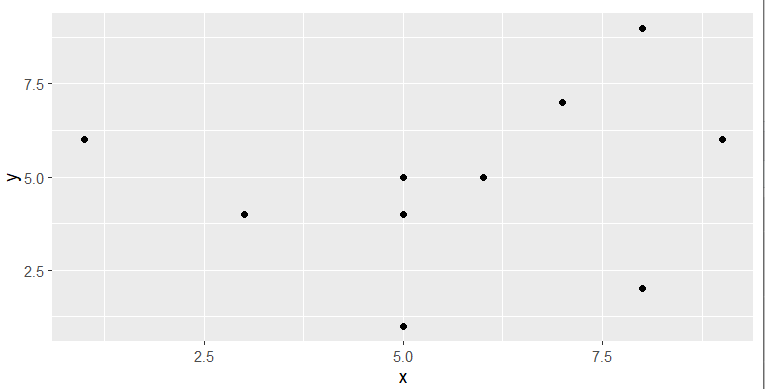
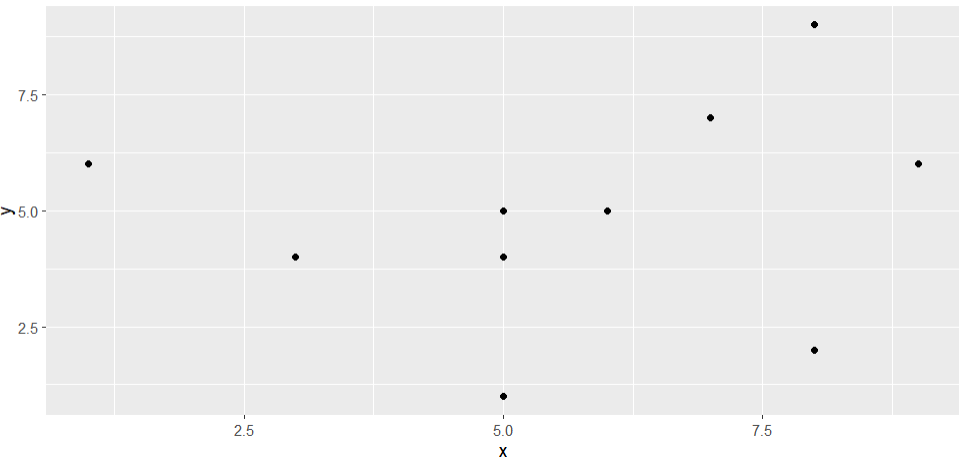
Example: Initial plot
R
library(ggplot2)
gfg<-data.frame(x=c(8,9,6,5,8,5,1,7,3,5),
y=c(9,6,5,4,2,5,6,7,4,1))
ggplot(data=gfg,aes(x=x, y=y)) + geom_point()
|
Output:
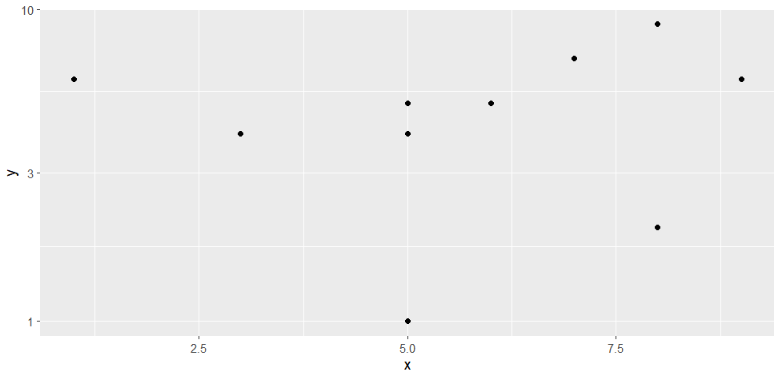
Example: Change axis intervals
R
library(ggplot2)
gfg<-data.frame(x=c(8,9,6,5,8,5,1,7,3,5),
y=c(9,6,5,4,2,5,6,7,4,1))
ggplot(data=gfg,aes(x=x, y=y)) + geom_point()+
scale_y_continuous(trans = 'log10')
|
Output:
Like Article
Suggest improvement
Share your thoughts in the comments
Please Login to comment...