If you’re looking to understand your data better, knowing how to calculate variance in Excel is a great skill to have. Calculating Variance in Excel is a Fundamental calculation that helps to measure the dispersion or spread of data points in a dataset. Luckily, Excel makes it easy to do this with some handy formulas.
In this article, we’ll walk you through how to use Excel to calculate variance, step by step. Whether you’re new to Excel or just need a quick refresher on variance, we’ve got you covered.

How To Calculate Variance in Excel
What is Variance in Excel?
Variance is a statistical measure used to quantify the dispersion or spread of data points in a dataset. It measures how far individual data points deviate from the mean(average ) of the dataset.
Variance provides information about the variability of the data. Variance quantifies how far individual data points deviate from the mean of the data. Variance is a measurement of the spread between numbers in a data set.
Simple Method to Calculate Variance
First, let’s learn about Variance. In real-life scenarios, we have populations like marks of students in a particular subject, and salaries of multiple employees in a company. Let us consider, in a company named ABC, we have 5 employees.
| Name |
Salary(USD) |
| a |
10k |
| b |
50k |
| c |
30k |
| d |
40k |
| e |
20k |
Now, it will tell us the expectation of standard deviation. In other words, the factor of difference in salaries.
The formula for Variance is will be shown as:
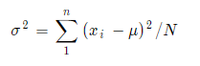
- xi represents each data point in the dataset.
- μ is the mean(average) of the dataset.
- Σ denotes the sum of the squared differences for each data point.
- n is the total number of data points in the dataset.
Where x represents the value, and μ is the mean of the sample.
- Mean = 30
- N = 5
- Var = 200
How to Calculate Variance in Excel?
To calculate Variance in Excel, you will need to have your own dataset already inserted into the software. Once you have your data, you can choose your formula based on the type of data set you have and the type of variance you need to calculate.
There are a few options for the formula to calculate variance depending on the type of data and the desired outcome.
In Excel we have formulas for everything and as you might have guessed for var also.
Note: We can have this list of formulas using the ‘=’ symbol shown below. You always need to use “=” symbol to tell Excel that you are entering a Formula.
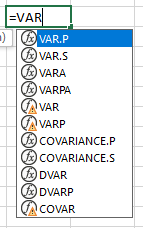
Variance Functions in Excel
Below are some Variance Functions available in Excel to help you choose the formula best suits you:
| Function |
Excel Version Support |
Data Type |
Treatment of Logicals & Text |
| VAR.S |
2010 – 2019 |
Sample |
Ignored |
| VARPA |
2000 – 2019 |
Population |
Evaluated |
| VARA |
2000 – 2019 |
Sample |
Evaluated |
| VARP |
2000 – 2019 |
Population |
Ignored |
| VAR |
2000 – 2019 |
Sample |
Ignored |
| VAR.P |
2010 – 2019 |
Population |
Ignored |
1. VAR.P Function in Excel
It calculates the var assuming that the entire population is its argument. It returns an approximate value and is used with a large population. Uses the same formula shown above.
=VARP(value1,value2, …)
2. VAR.S Function in Excel
It calculates the var assuming that the sample of the population is its argument. It returns an approximate value and is used with a large population. Uses the same formula shown below.
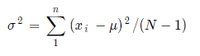
=VAR.S(value1,value2, …)
3. VARA Function in Excel
It includes text and logical symbols whereas the above 2 functions don’t include text and logical symbols. It is used for a sample of the population. Uses the “n-1” formula.
=VARA(value1,value2, …)
4. VARPA Function in Excel
It includes text and logical symbols. It is used for the whole population. Uses the “n” formula.
=VARPA(value1,value2,…)
5. VAR Function in Excel
The function applies the “n-1” formula, which compensates for the bias in variance calculation of a sample by using the sample size minus one.
=VAR(value1,value2, …)
6. VARP Function in Excel
The VARP function in Excel calculates the variance of an entire population, ignoring text and logical values, and uses the “n” formula, considering the total number of data points.
=VARP(value1,value2, …)
How to Calculate Sample Variance in Excel?
To calculate sample variance in Excel, you can use the VAR, VARA and VAR.S functions of Excel.
- Simply select the range of data you want to analyze
- Apply the function, like “
=VAR.S(A1:A9)" for a sample set in cells A1 through A9.
This method evaluates the variance based on the “n-1” formula, providing an accurate measure of dispersion for sample data by considering the sample size minus one.
Formulas for Sample Variance in Excel
The formulas for Sample Variance in Excel for a sample set of cells A1 through A9 will be:
=VAR(A1:A9)=VARA(A1:A9)=VAR.S(A1:A9)
How to Calculate Population Variance in Excel?
To calculate population variance in Excel, you can use the VARP, VAR.P or VARPA functions of Excel.
- Enter the range of your data
- Apply the function, such as “=VAR.P(A1:A9)” for data located in cells A1 to A9.
This approach utilizes the “n” formula, accurately reflecting the variance across the entire population by considering the total number of data points without subtracting one.
Formulas for Population Variance in Excel
The formulas for Population Variance in Excel for a sample set of cells A1 through A9 will be:
=VARP(A1:A9)=VAR.P(A1:A9)=VARPA(A1:A9)
Example of Calculating Variance in Excel
Follow the below steps to calculate variance:
Step 1: Organize your data
There are a few options for the formula to calculate variance depending on the type of data and the desired outcome. : Calculate the Mean( Average)
=AVERAGE(range)
Replace “range” with the actual range of data values. Press enter to obtain the mean value.
Step 3: Calculate the Deviation.
Find the Deviation of each data point from the mean. The deviation is obtained by subtracting the mean from each data point. (A2- $B$2)
Step 4: Square the Deviations
Now Square each deviation to prepare for calculating variance.
Step 5: Calculate Variance
Step 6: Interpret the variance
Let’s see the difference here,
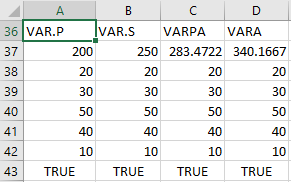
Here, the discrepancy occurs because VARPA and VARA read TRUE as 1 and VAR.P and VAR.S ignore it.
The formula goes like this –
- =STDEV.P(A38:A43) [Formula used in A37 cell]
- =STDEV.S(B38:B43) [Formula used in B37 cell]
- =STDEVPA(C38:B43) [Formula used in C37 cell]
- =STDEVA(D38:B43) [Formula used in D37 cell]
Note: VAR and VARP are for Excel 2007 or earlier. DVAR and DVARP are used for fetching data from Database.
Variance Vs. Standard Deviation in Excel
Variance and standard deviation are essential statistical measures in Excel that help us understand data variability. While variance provides valuable insights into data spread, it may seem less practical on its own. However, it serves as the foundation for calculating standard deviation, which is a more informative and widely used measure of data variation.
Standard deviation is computed as the square root of the variance. So, by taking the square root of 16, we get a standard deviation of 4. Now, standard deviation offers a more meaningful representation of data variability.
How To Calculate Variance in Excel – FAQs
How do you calculate variance in Excel?
To calculate variance in Excel, you can use the VAR.S or VAR.P Functions, depending on whether you are working with a sample or the entire population data. Simply select the data range and enter the appropriate formula to obtain the variance value.
How to interpret the variance value in Excel?
A higher variance value suggests greater data spread from the mean, indicating increased variability. Conversely, a smaller variance indicates data points are closer to the mean, implying less variability.
Is there any other Excel Function to calculate variance?
In addition to VAR.S and VAR.P, Excel offers other variance-related functions like VARA, VARP, VAR.S.NA, and VAR.P.NA. However, VAR.S and VAR.P are the most commonly used functions for variance calculations in Excel.
What is var function in Excel?
The VAR function in Excel calculates the variance of a sample, ignoring text and logical values, using the “n-1” formula.
Share your thoughts in the comments
Please Login to comment...