The Standard Deviation is a statistical measure that helps us to understand the amount of variance in a dataset. This statistic can be quite helpful in determining how similar or distinct your data is. Standard deviation may be calculated in Microsoft Excel quickly if you know the formulas and commands to use.
In this article, we examine the functions of standard deviation, clarify how to compute standard deviation in Excel and give an illustration.

What is Standard Deviation?
A statistic called standard deviation assesses a dataset’s dispersion about its mean. It is determined as the variance’s square root (the spread of numbers in a dataset). When comparing data sets that may have the same mean but a distinct range, knowing the variation between each data point relative to the mean is helpful.
In real-life scenarios, we have populations like marks of students in a particular subject, and salaries of multiple employees in a company. Let us consider, in a company named ABC, we have 5 employees.
| Name |
Salary(USD) |
| a |
20k |
| b |
50k |
| c |
40k |
| d |
10k |
| e |
30k |
Now, it will tell us how these salaries are dispersed across this company.
Formula for Standard Deviation
The formula to calculate Standard Deviation in Excel:
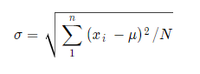
- Where x represents the value, and μ is the mean of the population.
- Mean = 30
- N = 5
- Std = 14.14
Why Use Standard Deviation Formula in Excel
The standard Deviation can be very helpful in many ways. Below are are the reasons that tell us that why finding Standard Deviation in Excel can be of great help.
- Because it may be used to gauge market volatility, the standard deviation is often utilized to plan trading and investing strategies.
- Standard deviation is used by analysts, portfolio managers, and advisors as a fundamental risk indicator.
- Even the standard deviation of their mutual funds will be disclosed by investment firms.
The statistics are often simple to comprehend, which makes it useful to present them to clients and investors. Excel may be quite helpful in terms of time management by calculating and displaying the standard deviation.
Difference between Sample and Population Standard Deviation
The difference between sample and population standard deviation lies primarily in their definitions and the formula used to calculate them.
- The population standard deviation is used when considering the entire dataset of a population, providing a precise measure of dispersion. It’s calculated using the square root of the variance, where the variance is the average of the squared differences from the Mean.

- In contrast, the sample standard deviation is applied when analyzing a subset of a population, intended as an estimate of the population standard deviation. The calculation adjusts for the smaller sample size by dividing by n−1 (where n is the sample size) instead of n, making it slightly larger than the population standard deviation for the same set of data.

How to Calculate Standard Deviation in Excel
Now, let’s learn how to use it in Excel. In Excel, we have formulas for everything and as you might have guessed for Standard Deviation also. You can calculate the standard deviation with the help of six functions in Excel. Based on the data whether sample or population you have to decide which function to apply.
Let’s learn about these six functions below:

Functions of Standard Deviation
Sample Standard Deviation Functions in Excel
1. Excel STDEV.S Function
It calculates the standard deviation assuming that the sample of the population is its argument. It returns an approximate value and is used with a large population.
Syntax: ” =STDEV.S([Number1]:[Number2]) “
- Number 1: Choose the cell in your spreadsheet that holds the first data point from the sample population for this input.
- Number 2: Choose the cell in your spreadsheet that has the final data point from the sample population for this input.
STDEV.S uses numerical values and ignores text and logical values.
2. Excel STDEV Function
It is the original standard deviation function and is supported by newer versions for just backward compatibility. In Excel 2007 and later, STDEV can accept up to 255 arguments. It is advised to use STDEV.S in new versions.
Syntax: ” =STDEV(number1,[number2],…) “
3. Excel STDEVA Function
It includes text and logical symbols, whereas the above 2 functions don’t include text and logical symbols. It is used for a sample of the population. Empty cells are ignored. It uses the “n-1” formula.
Syntax: ” =STDEVA(value1, [value2], …) “
Population Standard Deviation Functions in Excel
1. STDEV.P Function in Excel
It calculates the standard deviation assuming that the entire population is its argument. It returns an approximate value and is used with a large population.
Syntax: ” =STDEV.P(number1,[number2],…) “
2. STDEVP function in Excel
It is the old Excel function to find the standard deviation of a population.
Syntax: “ =STDEVP(number1,[number2],…) “
3. STDEVPA Function in Excel
It includes text and logical symbols. It is used for the whole population. Uses the “n” formula.
Syntax: ” =STDEVPA(value1, [value2], …) “
Note: STDEV and STDEVP are for Excel 2007 or earlier. DSTDEV and DSTDEVP are used for fetching data from Database.
No matter which Excel standard deviation Formula you choose, it’s crucial to understand that if any argument contains error values from other functions or text that can not be interpreted as a number, the formula will return an error. Double-check your data and ensure that all values are numeric and error-free before using the standard deviation formula in Excel.
Which Excel Standard Deviation Function to Use
Choosing the right Excel Standard deviation function can be a little confusing task, especially for beginners. You can consider the following points to select the appropriate formula for your specific task :
- Are you looking to calculate the standard deviation for a sample or a population?
- Which version of Excel are you using?
- Does your dataset contain only numbers, or does it include logical values and text as well?
If you want to work with a numeric sample, use the STVE.S Function in Excel 2010 and later versions, or the STDEV Function in Excel 2007 and earlier versions.
If you want to include logic or text values in the calculations, you can use either the STDEVA Function for sample standard deviation or the STDEVPA Function for population standard deviation. While these Functions may not be commonly used on their own, they can be helpful in larger formulas where arguments are returned as logical values or text representations of numbers.
Refer to the below table to decide which Excel deviation Function suits your needs:
|
Function
|
Excel Version
|
Sample
|
Population
|
Logical Values
|
Text
|
|
STDEV
|
2003-2019
|
Yes
|
|
Ignored
|
|
|
STDEV.S
|
2010-2019
|
Yes
|
|
Ignored
|
|
|
STDEVP
|
2003-2019
|
|
Yes
|
Ignored
|
|
|
STDEV.P
|
2010-2019
|
|
Yes
|
Ignored
|
|
|
STDEVA
|
2003-2019
|
Yes
|
|
Evaluated
|
Evaluated as Zero
|
|
STDEVPA
|
2002-2019
|
|
Yes
|
Evaluated
|
Evaluated as Zero
|
|
|
|
|
|
(True =1,
False=0)
|
|
|
Empty cells
|
|
|
|
Ignored
|
|
Excel Standard Deviation Formula Examples
Once you have chosen the Function for your data type, writing the formula is straightforward and error-free. The syntax is simple and transparent, making it easy to apply Excel’s standard deviation formulas. Let’s discuss a few examples:
Calculating Standard Deviation of a Sample and Population
When calculating the standard deviation in Excel, you have different formulas to use depending on whether you are working with a sample or the entire population:
For population standard deviation, which applies to the entire list of values, you can use the STEDV.P Function.
For example: If your data is in the range A3:A30, the formula would be:
=STDEV.S(A2:A14)
Note:
- It is mandatory to notice the results from these formulas may slightly differ, mainly while working with smaller sample sizes.
- If you are using Excel 2007 or earlier versions, you would use the STDEVP and STDEV functions.
Example of How to Calculate Standard Deviation Using STDEV.S in Excel
Step 1: Open the Excel Sheet
Open an Excel Sheet with the Data
.webp)
Open Excel Sheet
Step 2: Enter Formula
Apply the Formula in the formula bar. Here we are applying the STDEV.S formula. Enter the first and last argument

Enter Formula
Step 3: Press Enter and Check the Result
You can see the output after pressing the enter key on your keyboard.

How to Add Standard Deviation Bars in Excel
If you want to visually represent the margin of errors with standard deviation, you can easily add standard deviation bars to your Excel chart.
Follow the steps to add standard deviation bars :
Step 1: Create your Chart
Create your chart by selecting the data and choosing the appropriate chart type from the Insert tab in the Charts group.

Create your Chart
Step 2: Select the Chart and Chart Element button
After creating the chart, click anywhere on the chart to activate the chart Elements and a dropdown menu, click the arrow next to” Error bars” to explore the options. Click on the Chart Element button, to open a drop drop list.
Step 3: Click on the arrow next to “Error Bars”.
In the drop-down list, click on the arrow next to Error Bars, to expand the options.
Step 4: Select the Standard Deviation
From the options, select “Standard deviation“
.webp)
Select Error Bars > Standard Deviation
Difference between Standard Deviation and Standard Error of the Mean in Excel
When it comes to estimating the variability in data, there is another statistical measure called “the standard error of the mean” also known as “standard error“.
- The standard deviation measures the dispersion or variability of a dataset around the mean. It tells you how spread out the individual data points are from the average.
- On the other hand, the standard error of the mean provides an estimate of how much the sample mean is expected to deviate from the true population mean.
In simpler words, if we were to take multiple samples from the same population, the standard error of the mean would show us the range of variability between those sample means.
Since we calculate a single mean from a dataset rather than multiple means, the standard error of the mean is an estimation rather than a direct measurement. It is worth noting that the standard deviation is always larger than the standard error of the mean.
To calculate the standard error of the mean in your Excel worksheets, you can use the STDEV.S Function in combination with COUNT and SORT. The below formula can be used:
=STDEV.S(range)/SQRT(COUNT(range))
For example, if your sample data is located in cells A2 to A14 you can use the following formula to calculate the SEM:
=STDEV.S(A2:A14)/SQRT(COUNT(A2:A14))
The result will provide an estimation of the standard error of the mean.

Conclusions
In the above article, we discussed calculating the standard deviation of both sample data and population. This can be done using different functions. All functions have their usage. Further, we discussed this by taking an example and learning the procedure in detail. We also learned about standard error bars and the standard error of the mean.
Standard Deviation in Excel – FAQs
What is Standard Deviation?
A statistic called standard deviation assesses a dataset’s dispersion in relation to its mean. It is determined as the variance’s square root (the spread of numbers in a dataset). When comparing data sets that may have the same mean but a distinct range, knowing the variation between each data point relative to the mean is helpful.
How we can calculate Standard Deviation in Excel?
By using STDEV Function you can calculate the standard deviation. You can use the below formula: “=STDEV(range) “, where “range” represents the range of cells containing the dataset.
Which standard deviation should I use?
Population standard deviation is for when you have all the numbers in a group. Sample standard deviation is for when you have only a part of the numbers from a bigger group.
How to calculate variance in Excel?
To calculate variance in Excel, use the VAR function. Simply enter “=VAR” followed by the range of data cells, then close parentheses and press Enter. For example, ” =VAR(A1:A10) ” for cells A1 to A10.
Should I use STDEV S or STDEV P in Excel?
STDEV.P finds standard deviation for a whole group, while STDEV.S is for a sample.
Like Article
Suggest improvement
Share your thoughts in the comments
Please Login to comment...