How to Calculate Quantiles by Group in R?
Last Updated :
23 Dec, 2021
In this article, we will discuss how to calculate quantiles by the group in R programming language.
To obtain the required quartiles, quantile() function is used.
Syntax:
quantile( data, probs)
Parameters:
- data: data whose percentiles are to be calculated
- probs: percentile value
To group data, we use dplyr module. This module contains a function called group_by() in which the column to be grouped by has to be passed.
Syntax:
group_by(column_name)
To find quantiles of the grouped data we will call summarize method with quantiles() function.
Syntax:
summarize( function )
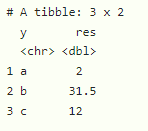
Example 1: Calculate Quantiles by group by summarizing one quartile with probability 0.5
R
library(dplyr)
df<-data.frame(x=c(2,13,5,36,12,50),
y=c('a','b','c','c','c','b'))
df %>% group_by(y) %>%
summarize(res=quantile(x,probs=0.5))
|
Output:
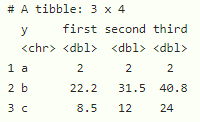
Example 2: Calculate quantiles by group by summarizing three quartiles with probability 0.25, 0.5, and 0.75.
R
library(dplyr)
df<-data.frame(x=c(2,13,5,36,12,50),
y=c('a','b','c','c','c','b'))
df %>% group_by(y) %>%
summarize(first=quantile(x,probs=0.25),
second=quantile(x,probs=0.5),
third=quantile(x,probs=0.75))
|
Output:
Share your thoughts in the comments
Please Login to comment...