In this article, we will be looking at how to calculate the moving average in a Pandas data frame. Moving Average calculates the average of data over some periods. The moving average is also known as the rolling mean and is calculated by averaging data of the time series within k periods.
Calculating Moving Averages using Pandas
There are various methods to calculate the moving average in Pandas DataFrame, we are discussing some generally used methods for calculating the moving average in Pandas DataFrame which are the following
The link to the data used is RELIANCE.NS_
Simple Moving Average (SMA) Syntax
To calculate a Simple Moving Average in Pandas DataFrame we will use Pandas dataframe.rolling() action that helps us to make calculations on a rolling window. On the rolling window, we will use .mean() function to calculate the mean of each window.
Syntax: DataFrame.rolling(window, min_periods=None, center=False, win_type=None, on=None, axis=0).mean()
Parameters :
- window : Size of the window. That is how many observations we have to take for the calculation of each window.
- min_periods : Least number of observations in a window required to have a value (otherwise result is NA).
- center : It is used to set the labels at the center of the window.
- win_type : It is used to set the window type.
- on : Datetime column of our dataframe on which we have to calculate rolling mean.
- axis : integer or string, default 0
Simple Moving Average (SMA)
A simple moving average tells us the unweighted mean of the previous K data points. The more the value of K the more smooth is the curve, but increasing K decreases accuracy. If the data points are p1, p2, . . . , pn then we calculate the simple moving average.

In Python, we can calculate the moving average using .rolling() method. This method provides rolling windows over the data, and we can use the mean function over these windows to calculate moving averages. The size of the window is passed as a parameter in the function .rolling(window).
Now let’s see an example of how to calculate a simple rolling mean over a period of 30 days.
Step 1: Importing Libraries
In below code we are import the Pandas library as ‘pd’ and the NumPy library as ‘np’ for data manipulation and mathematical calculations, respectively. Additionally, Matplotlib’s pyplot module is imported as ‘plt’ for plotting graphs, with the default style set, and `%matplotlib inline` is included to display the plots inline in Jupyter notebooks.
Python3
import pandas as pd
import numpy as np
import matplotlib.pyplot as plt
plt.style.use('default')
%matplotlib inline
|
Step 2: Importing Data
To import data we will use pandas .read_csv() function.
Python3
reliance = pd.read_csv('RELIANCE.NS.csv', index_col='Date',
parse_dates=True)
reliance.head()
|
Output:

Step 3: Dataframe by extract Columns
In this example the below code refines ‘reliance’ DataFrame by extracting the ‘Close’ column, computes a 30-day SMA, and prints the cleaned DataFrame, a standard step in financial analysis for technical indicator computation.
Python3
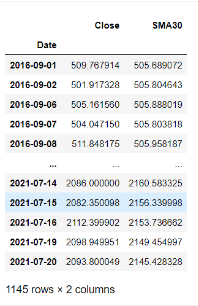
reliance = reliance['Close'].to_frame()
reliance['SMA30'] = reliance['Close'].rolling(30).mean()
reliance.dropna(inplace=True)
reliance
|
Output:
Step 4: Plotting Simple Moving Averages
In this example the code uses the `plot()` method to visualize the Close price and a 30-day Simple Moving Average (SMA) of the ‘reliance’ DataFrame, with ‘RELIANCE’ as the label, and a specified figure size of 16×8.
Python3
reliance[['Close', 'SMA30']].plot(label='RELIANCE',
figsize=(16, 8))
|
Output:

Cumulative Moving Average (CMA) Syntax
To calculate Cumulative Moving Average in Pandas Dataframe we will use dataframe.expanding() function. This method gives us the cumulative value of our aggregation function (mean in this case).
Syntax: DataFrame.expanding(min_periods=1, center=None, axis=0, method=’single’).mean()
Parameters:
- min_periods : int, default 1 . Least number of observations in a window required to have a value (otherwise result is NA).
- center : bool, default False . It is used to set the labels at the center of the window.
- axis : int or str, default 0
- method : str {‘single’, ‘table’}, default ‘single’
Cumulative Moving Average (CMA)
The Cumulative Moving Average is the mean of all the previous values up to the current value. CMA of dataPoints x1, x2 ….. at time t can be calculated as,

While calculating CMA we don’t have any fixed size of the window. The size of the window keeps on increasing as time passes. In Python, we can calculate CMA using .expanding() method. Now we will see an example, to calculate CMA for a period of 30 days.
Step 1: Importing Libraries
Here , the code imports essential data manipulation libraries: Pandas for handling data frames, NumPy for mathematical operations, and Matplotlib’s Pyplot for plotting graphs with a default style. The `%matplotlib inline` command ensures that plots are displayed within the Jupyter Notebook environment.
Python3
import pandas as pd
import numpy as np
import matplotlib.pyplot as plt
plt.style.use('default')
%matplotlib inline
|
Step 2: Importing Data
To import data we will use pandas .read_csv() function.
Python3
reliance = pd.read_csv('RELIANCE.NS.csv',
index_col='Date',
parse_dates=True)
reliance.head()
|
Step 3:Transform Dataframe by Columns
In this example the below code first transforms the ‘reliance’ DataFrame to include only the ‘Close’ column, converting it into a DataFrame. Then, it computes the Cumulative Moving Average (CMA) with a window size of 30 for the ‘Close’ column. Finally, the resulting DataFrame, including the CMA values, is printed.
Python3
reliance = reliance['Close'].to_frame()
reliance['CMA30'] = reliance['Close'].expanding().mean()
reliance
|
Output:

Step 4: Plotting Cumulative Moving Averages
In this example code uses the `.plot()` method to visualize the ‘Close’ price and 30-day Cumulative Moving Average (CMA30) of Reliance stock, with the specified label and figure size.
Python3
reliance[['Close', 'CMA30']].plot(label='RELIANCE',
figsize=(16, 8))
|
Output

Exponential Moving Average (EMA) Syntax
To calculate Exponential moving average in Pandas Dataframe use dataframe.ewm() function. It provides us exponentially weighted functions. We will be using .mean() function to calculate EMA.
Syntax: DataFrame.ewm(com=None, span=None, halflife=None, alpha=None, min_periods=0, adjust=True, ignore_na=False, axis=0, times=None).mean()
Parameters:
- com : float, optional . It is the decay in terms of centre of mass.
- span : float, optional . It is the decay in terms of span.
- halflife : float, str, timedelta, optional . It is the decay in terms of halflife.
- alpha : float, optional . It is the smoothing factor having value between 0 and 1 , 1 inclusive .
- min_periods : int, default 0. Least number of observations in a window required to have a value (otherwise result is NA).
- adjust : bool, default True . Divide by decaying adjustment factor in beginning periods to account for imbalance in relative weightings (viewing EWMA as a moving average)
- ignore_na : Ignore missing values when calculating weights; specify True to reproduce pre-0.15.0 behavior.
- axis : The axis to use. The value 0 identifies the rows, and 1 identifies the columns.
Exponential Moving Average
Exponential moving average (EMA) tells us the weighted mean of the previous K data points. EMA places a greater weight and significance on the most recent data points. The formula to calculate EMA at the time period t is:
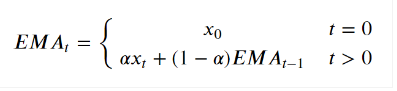
where xt is the value of observation at time t & α is the smoothing factor. In Python, EMA is calculated using .ewm() method. We can pass span or window as a parameter to .ewm(span = ) method. Now we will be looking at an example to calculate EMA for a period of 30 days.
Step 1: Importing Libraries
In below code imports the Pandas library as ‘pd’ for data manipulation, NumPy as ‘np’ for mathematical calculations, and Matplotlib’s pyplot module as ‘plt’ for creating graphs. Additionally, `%matplotlib inline` ensures that plots are displayed inline in Jupyter notebooks.
Python3
import pandas as pd
import numpy as np
import matplotlib.pyplot as plt
plt.style.use('default')
%matplotlib inline
|
Step 2: Importing Data
To import data we will use pandas .read_csv() function.
Python3
reliance = pd.read_csv('RELIANCE.NS.csv',
index_col='Date',
parse_dates=True)
reliance.head()
|
Output :

Step 3: Isolates Column by Dataframe
In this example the below code isolates the ‘Close’ column in the ‘reliance’ DataFrame, converts it into a DataFrame, computes the Exponential Moving Average (EWMA) with a span of 30 for the ‘Close’ column, and prints the resulting DataFrame containing the EWMA values.
Python3
reliance = reliance['Close'].to_frame()
reliance['EWMA30'] = reliance['Close'].ewm(span=30).mean()
reliance
|
Output :

Step 4: Plotting Exponential Moving Averages
Here, code uses the `plot()` method to visualize the Close price and a 30-day Exponential Moving Average (EWMA) of the RELIANCE stock, displaying them on the same plot with a specified label and figure size.
Python3
reliance[['Close', 'EWMA30']].plot(label='RELIANCE',
figsize=(16, 8))
|
Output :

Like Article
Suggest improvement
Share your thoughts in the comments
Please Login to comment...