How to Calculate an Exponential Moving Average in R?
Last Updated :
21 Feb, 2022
In this article, we will look the how to Calculate an Exponential Moving Average in R Programming Language.
Exponential moving average (EMA) tells us the weighted mean of the previous K data points. EMA places a greater weight and significance on the most recent data points. To get the EMA we will use pracma package in the R programming language. To install run the following commands:
install.packages("pracma")
Creating Dataframe for demonstration
R
df <- data.frame(Rank=1:10,
Marks=c(65, 60, 54, 46, 37,
30, 29, 25, 24, 19))
print(df)
|
Output:
   Rank Marks
1     1    65
2     2    60
3     3    54
4     4    46
5     5    37
6     6    30
7     7    29
8     8    25
9     9    24
10   10    19
Calculate an Exponential Moving Average in R
movavg() function is used to calculate the EMA in R.
movavg(x, n, type=c(“s”, “t”, “w”, “m”, “e”, “r”))
Arguments
- x: time series as numeric vector.
- n: backward window length.
- type: one of “s”, “t”, “w”, “m”, “e”, or “r”.
R
library(pracma)
df <- data.frame(Rank=1:10,
Marks=c(65, 60, 54, 46, 37,
30, 29, 25, 24, 19))
df$EMA <- movavg(df$Marks, n=3, type='e')
print(df)
|
Output:
   Rank Marks      EMA
1     1    65 65.00000
2     2    60 62.50000
3     3    54 58.25000
4     4    46 52.12500
5     5    37 44.56250
6     6    30 37.28125
7     7    29 33.14062
8     8    25 29.07031
9     9    24 26.53516
10   10    19 22.76758
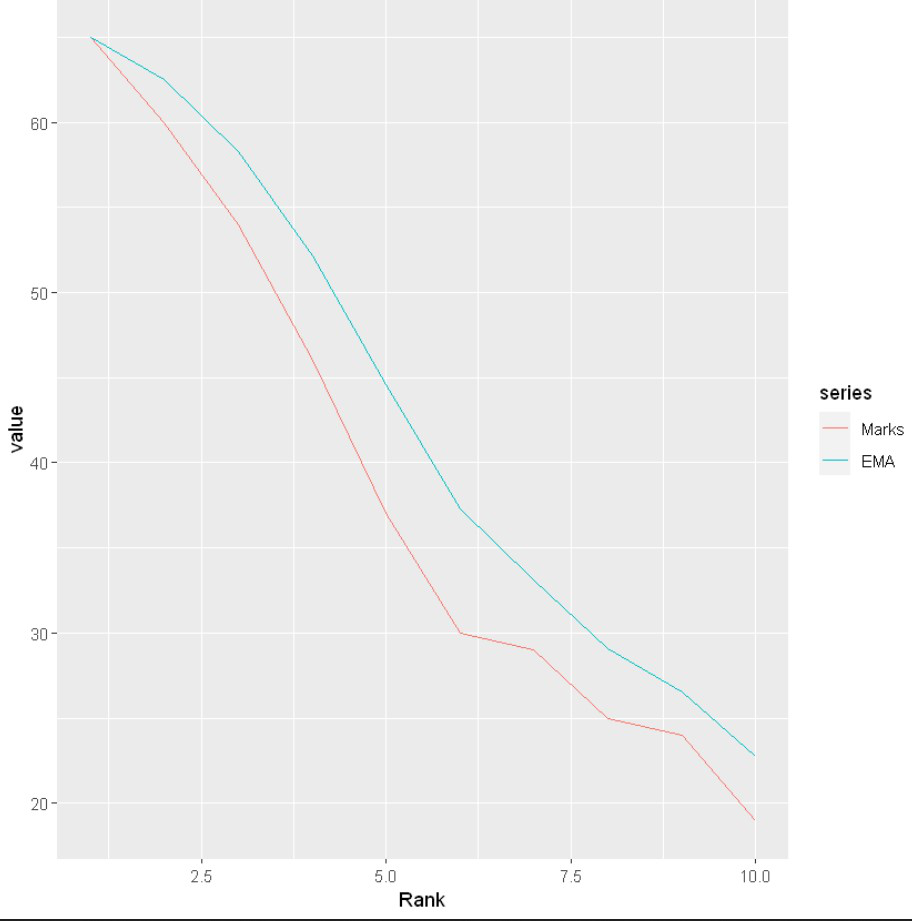
Visualization of EMA
Here, we will be visualizing the marks compared to the 3-day exponentially weighted moving average through the line plot.
R
library(ggplot2)
library(reshape2)
library(pracma)
df <- data.frame(Rank=1:10,
Marks=c(65, 60, 54, 46, 37,
30, 29, 25, 24, 19))
df$EMA <- movavg(df$Marks, n=3, type='e')
df <- melt(df , id.vars = 'Rank', variable.name = 'series')
ggplot(df, aes(Rank, value)) +
geom_line(aes(colour = series))
|
Output:
Share your thoughts in the comments
Please Login to comment...