Before you read this article and learn automation in Python….let’s watch a video of Christian Genco (a talented programmer and an entrepreneur) explaining the importance of coding by taking the example of automation.
You might have laughed loudly after watching this video and you surely, you might have understood the importance of automation in real life as well. Let’s come to the topic now…
We all know that Python is ruling all over the world, and we also know that Python is beginner’s friendly and it’s easy to learn in comparison to other languages. One of the best things you can do with Python is Automation.

Consider a scenario that you’re asked to create an account on a website for 30,000 employees. How would you feel? Surely you will be frustrated doing this task manually and repeatedly. Also, this is going to take too much time which is not a smart decision.
Now just imagine the life of employees who are into the data entry jobs. Their job is to take the data from tables such as Excel or Google Sheet and insert it somewhere else. They browse different websites and magazine, they collect the data from there, and then they insert it into the database. They also need to do the calculations for the entries.
Generally, the income is based on the performance in this job. More entries, higher salary (of course everyone wants a higher salary in their job).
But don’t you think that it’s boring to do the same kind of stuff repeatedly?
Now the question is….“How can I do it fast?”, “How can I automate my work?”
Instead of doing these kinds of tasks manually, just spend an hour coding and automate these kinds of stuff to make your life easier. You can automate your tedious task by just writing fewer lines of code in Python.
In this blog, we will create a small project to learn automation in Python. If you’re a beginner then you may prefer to watch some videos to learn the automation in Python and reading this blog might be a boring task for you but here we will go through step by step to explain everything in detail and to make things easier for you.
It will be great if you already know the core concept of Python. We will take an example of an Excel sheet with some entries, and we will learn the automation process. We are going to write a Python program that can process thousands of spreadsheets in under a second. Excited??? Let’s get started…
Intro of The Task
Processing or updating thousands of spreadsheets manually will take too much time. It may take hours, days, or even months. We will write a Python program to automate this task. We will work on a spreadsheet given in the below picture.
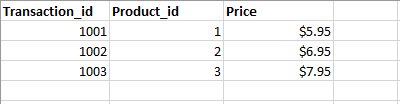
In this spreadsheet, we have the record for all kinds of transactions, but let’s say due to an error (human error or system error), the price for the product listed in the third column is wrong. Let’s say we need to decrease the price by 10% (multiply the price by 0.9 and recalculate the value). You can do this task manually by using a mathematical formula in the fourth column but it will take too much time (maybe 1 week or two weeks) if there are thousands of records.
We will write a python program to automate this process. Also, we will add a chart to it. Our python program will do this task for us in a matter of seconds.
Let’s Get Into The Coding Zone
To work on this Excel sheet we are going to use a library openpyxl. Create a folder in your directory, give it a name and install the openpyxl package by executing the following command in your terminal.
pip install openpyxl
Now we can import this package to work on our spreadsheet. Before that add the spreadsheet in your project folder. Now create a file app.py in your folder and write down the code given below.
Python
import openpyxl as xl
from openpyxl.chart import BarChart, Reference
wb = xl.load_workbook('python-spreadsheet.xlsx')
sheet = wb['Sheet1']
for row in range(2, sheet.max_row + 1):
    cell = sheet.cell(row, 3)
corrected_price = float(cell.value.replace('$','')) * 0.9
corrected_price_cell = sheet.cell(row, 4)
corrected_price_cell.value = corrected_price
values = Reference(sheet, min_row=2, max_row=sheet.max_row, min_col=4, max_col=4)
chart = BarChart()
chart.add_data(values)
sheet.add_chart(chart, 'e2')
wb.save('python-spreadsheet2.xlsx')
|
Let’s Understand the Above Code
We are going to explain the code step by step written above to understand the complete process.
Step 1. To work on our spreadsheet import openpyxl package (we have used xl alias to make our code cleaner and shorter). Also, to add a chart to our spreadsheet, we need to import two classes BarChart and Reference.
import openpyxl as xl
from openpyxl.chart import BarChart, Reference
Step 2. Now we need to load the Excel workbook python-spreadhsheet.xlsx. Write down the code given below. wb returns the object and with this object, we are accessing Sheet1 from the workbook.
wb = xl.load_workbook('python-spreadsheet.xlsx')
sheet = wb['Sheet1']
Step 3. To access the entries from rows 2 to 4 in the third column (entry for price column) we need to add a for loop in it. We are saving this entry in a variable cell.
for row in range(2, sheet.max_row + 1):
cell = sheet.cell(row, 3)
Step 4. Now we need to calculate the corrected prices. So we are multiplying the values saved in the cell variable with 0.9. Once the calculation is done we need to add all the corrected prices in a new column (column 4). To add a new column we will get a reference to the cell in the given row but in the fourth column. Once the cell is created, we need to set the corrected price values in this cell (fourth column).
corrected_price = float(cell.value.replace('$','')) * 0.9
corrected_price_cell = sheet.cell(row, 4)
corrected_price_cell.value = corrected_price
Step 5. Half of the work is done. We have calculated the updated price, and we have added that in the fourth column. Now we need to add a chart to the current sheet. To create a chart we need to select a range of values.
In this project, we will select the values in the fourth column (updated prices) and we will use that in our chart (we just need a bunch of numbers to create a chart, so we have taken the example of the fourth column. This value can be anything as per requirement).
We need to use the reference class to select a range of values. We are going to add five arguments to this constructor. The first argument is the sheet we are working on. The next two arguments min_row = 2, and max_row= sheet.max_row will select the cells from row 2 to row 4. To select the entries from only column fourth we need to pass another two arguments min_col=4 and max_col=4. Store the result in the variable ‘values’.
values = Reference(sheet, min_row=2, max_row=sheet.max_row, min_col=4, max_col=4)
Step 6. Now we are ready to create a chart. We will create an instance ‘chart’ for the class BarChart. Once this is created add the values in this chart. After that add this chart to the sheet into row 2 and column 5 (e2).
chart = BarChart()
chart.add_data(values)
sheet.add_chart(chart, 'e2')
Step 7. Now we need to save all updated entries and the chart we have created in the above code. We will save this in a new file python-spreadsheet2.xlsx because we don’t’ want to accidentally overwrite the original file in case our program has a bug.
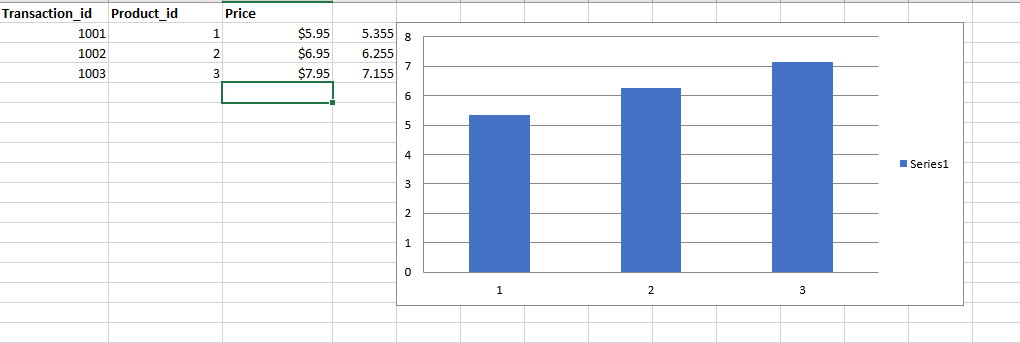
Run your program and you’re good to go. A newly updated file python-spreadhsheet2.xlsx will be created for you with updated prices and charts. Below is the screenshot for the same.
Step 8. Our program is complete but if you use the above code then it’s not going to automate the process of thousands of spreadsheets. This program is only relying on a specific file that is python-spreadsheet.xlsx.
To make it work for several spreadsheets we will reorganize this code, and we will move the code inside a function. This function will take the name of the file as an input and it will execute the process. Below is the updated code for the same.
Python
import openpyxl as xl
from openpyxl.chart import BarChart, Reference
def process_workbook(filename):
wb = xl.load_workbook(filename)
sheet = wb['Sheet1']
for row in range(2, sheet.max_row + 1):
cell = sheet.cell(row, 3)
corrected_price = float(cell.value.replace('$', '')) * 0.9
corrected_price_cell = sheet.cell(row, 4)
corrected_price_cell.value = corrected_price
values = Reference(sheet, min_row=2, max_row=sheet.max_row, min_col=4, max_col=4)
chart = BarChart()
chart.add_data(values)
sheet.add_chart(chart, 'e2')
wb.save(filename)
|
Github Link for the Code with Spreadsheet Attached: Python Automation
Final Thought
That was just one example of using Python to automate repetitive boring tasks. But remember that automation is not just about Excel spreadsheets. There are so many things we can automate. You can search on various sites such as Github and you can automate a lot of things with Python.
Like Article
Suggest improvement
Share your thoughts in the comments
Please Login to comment...