How to apply different titles for each different subplots using Plotly in Python?
Last Updated :
06 Jul, 2022
Prerequisites: Python Plotly
In this article, we will explore how to apply different titles for each different subplot.
One of the most deceptively-powerful features of data visualization is the ability for a viewer to quickly analyze a sufficient amount of information about data when pointing the cursor over the point label appears. It provides us with the easiest way to read and analyze information from the document. It is a useful approach to demonstrate different titles for the different plots as it allows to reveal an amount of information related to each subplot graph.
Syntax: make_subplots(rows=int, cols=int, subplot_titles= ‘title’)
Parameters:
- cols: no. of columns
- rows: no of rows
- subplot_titles: (‘Subplot title1′,’Subplot title2’)
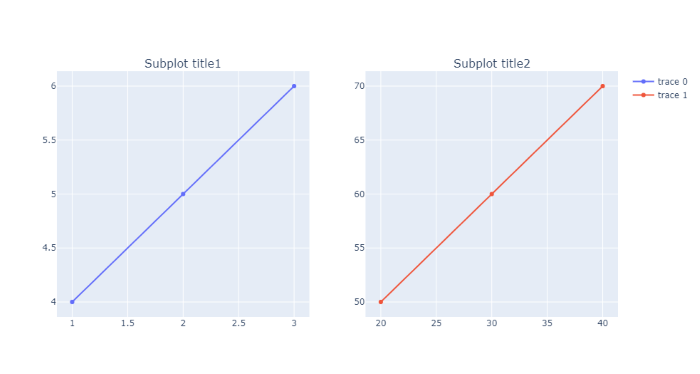
Example 1:
In this example, we have selected 1 row with 2 columns, the subplot title are assigned to subplot_titles while defining row and col in each trace one consecutive title from subplot_titles will assign to each subplot.
Python3
from plotly.subplots import make_subplots
import plotly.graph_objects as go
fig = make_subplots(rows=1,
cols=2,
subplot_titles=('Subplot title1',
'Subplot title2'))
fig.add_trace(
go.Scatter(x=[1, 2, 3], y=[4, 5, 6]),
row=1, col=1
)
fig.add_trace(
go.Scatter(x=[20, 30, 40], y=[50, 60, 70]),
row=1, col=2
)
fig.show()
|
Output:
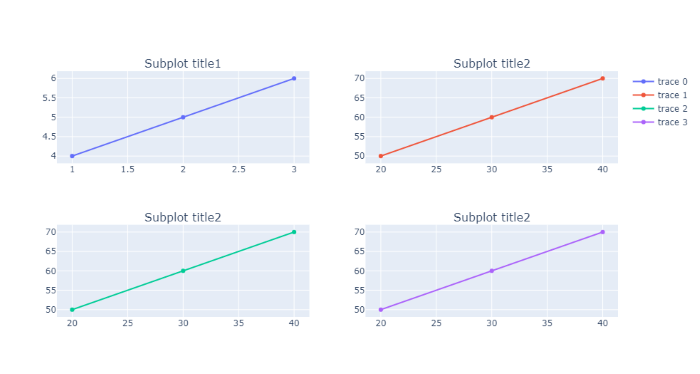
Example 2:
In this example, we have selected 2 rows with 2 columns, the subplot titles are assigned to subplot_titles while defining row and col in each trace one consecutive title from subplot_titles will assign to each subplot.
Python3
from plotly.subplots import make_subplots
import plotly.graph_objects as go
fig = make_subplots(rows=2,
cols=2,
subplot_titles=('Subplot title1',
'Subplot title2',
'Subplot title2',
'Subplot title2'))
fig.add_trace(
go.Scatter(x=[1, 2, 3], y=[4, 5, 6]),
row=1, col=1
)
fig.add_trace(
go.Scatter(x=[20, 30, 40], y=[50, 60, 70]),
row=1, col=2
)
fig.add_trace(
go.Scatter(x=[20, 30, 40], y=[50, 60, 70]),
row=2, col=1
)
fig.add_trace(
go.Scatter(x=[20, 30, 40], y=[50, 60, 70]),
row=2, col=2
)
fig.show()
|
Output:
Like Article
Suggest improvement
Share your thoughts in the comments
Please Login to comment...