How To Annotate Clusters with Circle/Ellipse by a Variable in R ggplot2
Last Updated :
24 Mar, 2022
In this article, we will discuss how to annotate Clusters with Circle/Ellipse by a categorical variable in the R Programming Language using the ggplot2 package.
To add a circle or ellipse around a cluster of data points, we use the geom_mark_circle() and geom_mark_ellipse() function of the ggforce package. This function automatically computes the circle/ellipse radius to draw around the cluster of points by categorical data.
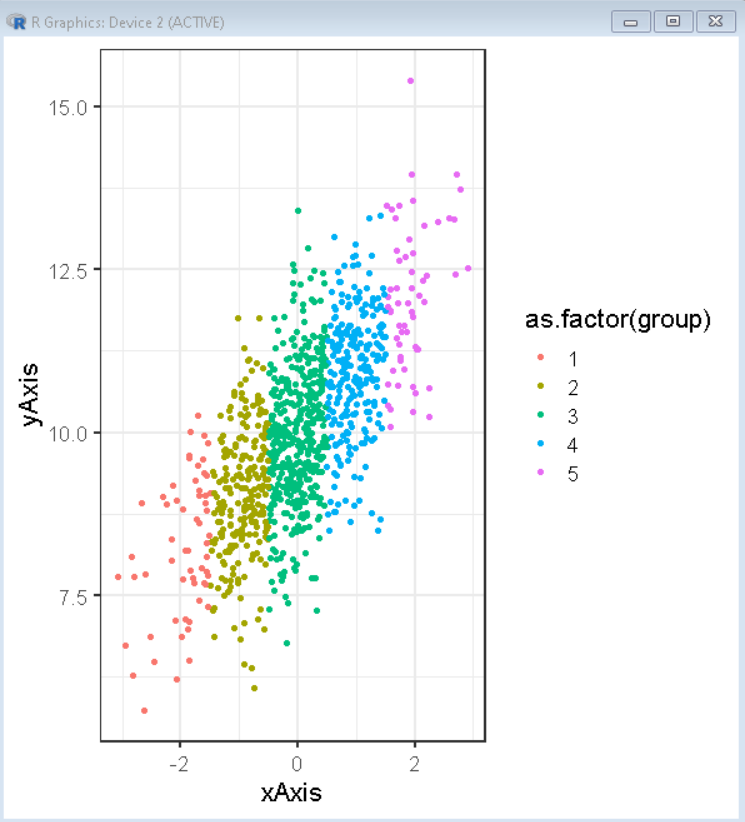
First, we will plot the data in a scatter plot using the geom_point function of the ggplot2 package. We will use the color parameter of the aes() function to color the plot by a categorical variable group.
Syntax:
ggplot(df, aes( x, y ) ) + geom_point( aes( color ))
Arguments:
- df: determines the data frame to be used.
- x and y: determine the x-axis and y-axis variables respectively.
- color: determines the categorical variable for coloring the data point clusters.
Example:
Here, is a basic scatter plot made using the geom_point() function of the ggplot2 package. We have colored the plot by the categorical variable group.
R
library(tidyverse)
theme_set(theme_bw(16))
xAxis <- rnorm(1000)
yAxis <- rnorm(1000) + xAxis + 10
group <- rep(1, 1000)
group[xAxis > -1.5] <- 2
group[xAxis > -0.5] <- 3
group[xAxis > 0.5] <- 4
group[xAxis > 1.5] <- 5
sample_data <- data.frame(xAxis, yAxis, group)
ggplot(sample_data, aes(x = xAxis,
y = yAxis))+
geom_point(aes(color = as.factor(group)))
|
Output:
Annotate circles around cluster:
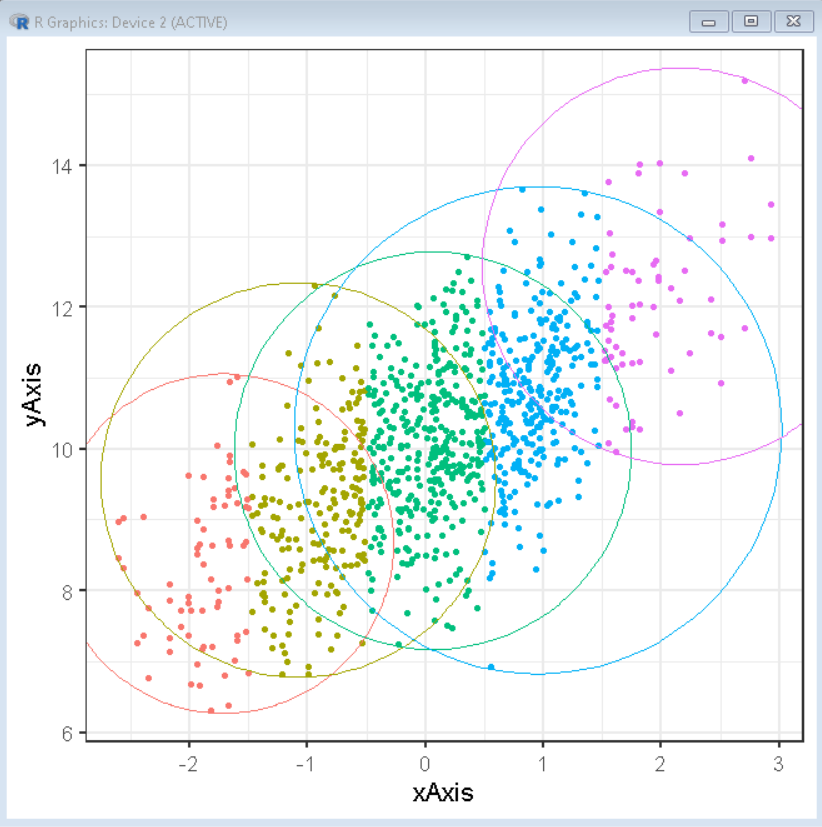
To annotate a circle around a cluster of points by the group we use the geom_mark_circle() function of the ggforce package. To use this function we first install & import the ggforce package by using:
install. packages('ggforce')
library(ggforce)
Now, we will annotate the circle around a cluster of data points by using the geom_mark_circle() function.
Syntax:
ggplot(df, aes( x, y ) ) + geom_point( aes( color )) + geom_mark_circle( aes(color) )
Example:
Here, is a basic scatter plot with circles around a cluster of data points colored by a categorical variable group.
R
library(tidyverse)
library(ggforce)
theme_set(theme_bw(16))
xAxis <- rnorm(500)
yAxis <- rnorm(1000) + xAxis + 10
group <- rep(1, 500)
group[xAxis > -1.5] <- 2
group[xAxis > -0.5] <- 3
group[xAxis > 0.5] <- 4
group[xAxis > 1.5] <- 5
sample_data <- data.frame(xAxis, yAxis, group)
ggplot(sample_data, aes(x = xAxis,
y = yAxis))+
geom_point(aes(color = as.factor(group)))+
geom_mark_circle(aes(color = as.factor(group)), expand = unit(0.5,"mm"))+
theme(legend.position = "none")
|
Output:
Annotate ellipses around cluster:
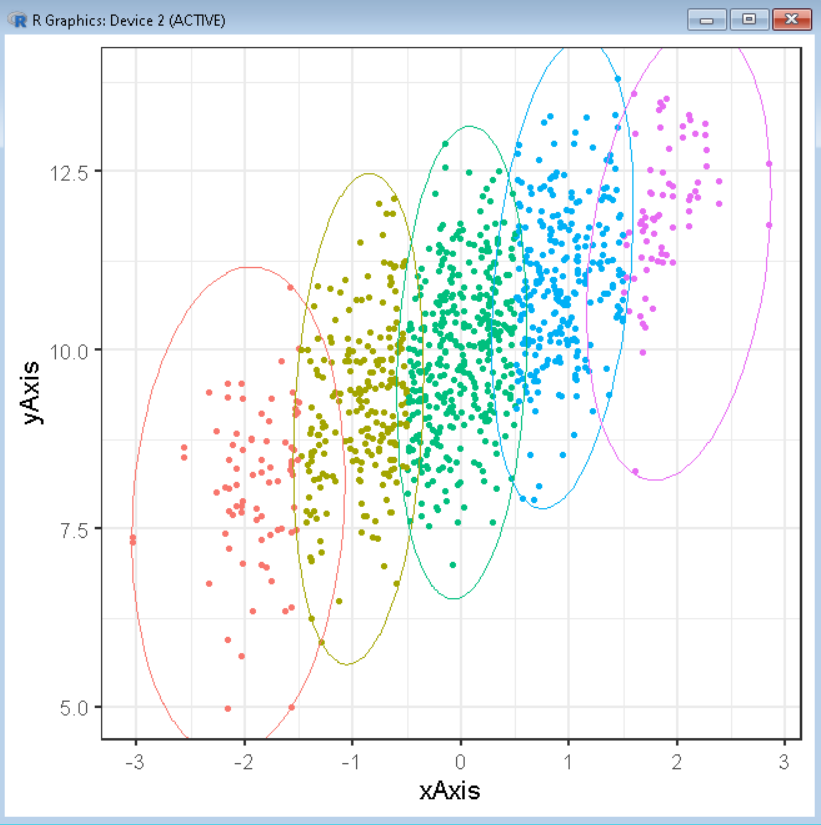
To annotate an ellipse around a cluster of points by the group we use the geom_mark_ellipse() function of the ggforce package. This function automatically computes the dimensions of the ellipse and overlays it on top of the scatter plot.
Syntax:
ggplot(df, aes( x, y ) ) + geom_point( aes( color )) + geom_mark_ellipse( aes(color) )
Example:
Here, is a basic scatter plot with ellipses around a cluster of data points colored by a categorical variable group.
R
library(tidyverse)
library(ggforce)
theme_set(theme_bw(16))
xAxis <- rnorm(500)
yAxis <- rnorm(1000) + xAxis + 10
group <- rep(1, 500)
group[xAxis > -1.5] <- 2
group[xAxis > -0.5] <- 3
group[xAxis > 0.5] <- 4
group[xAxis > 1.5] <- 5
sample_data <- data.frame(xAxis, yAxis, group)
ggplot(sample_data, aes(x = xAxis,
y = yAxis))+
geom_point(aes(color = as.factor(group)))+
geom_mark_ellipse(aes(color = as.factor(group)), expand = unit(0.5,"mm"))+
theme(legend.position = "none")
|
Output:
Customizing the aesthetics
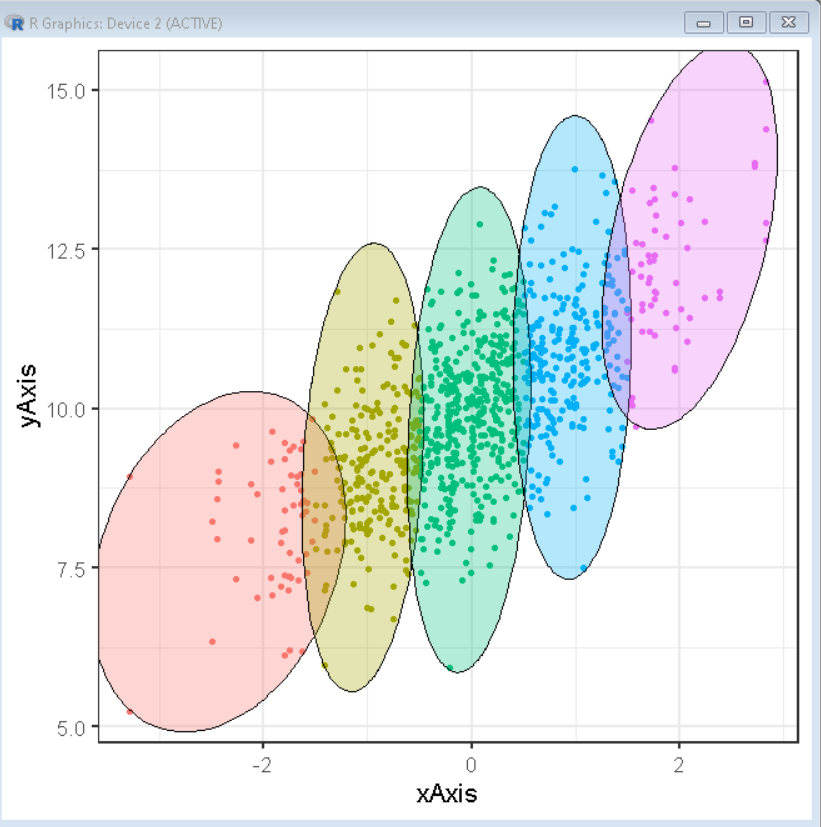
We can customize the aesthetics of the geom_mark_* function by using the color, fill, and alpha property of the aes() function.
Syntax:
ggplot(df, aes( x, y ) ) + geom_point( aes( color )) + geom_mark_ellipse( aes(color, fill, alpha) )
where,
- color: determines the color of the boundary of the circles or ellipses.
- fill: determines the background color of the circles or ellipses.
- alpha: determines the transparency of the circles or ellipses.
Example:
In this example, we will plot a scatter plot overlayed by ellipses with a background colored by the group categorical variable.
R
library(tidyverse)
library(ggforce)
theme_set(theme_bw(16))
xAxis <- rnorm(500)
yAxis <- rnorm(1000) + xAxis + 10
group <- rep(1, 500)
group[xAxis > -1.5] <- 2
group[xAxis > -0.5] <- 3
group[xAxis > 0.5] <- 4
group[xAxis > 1.5] <- 5
sample_data <- data.frame(xAxis, yAxis, group)
ggplot(sample_data, aes(x = xAxis,
y = yAxis))+
geom_point(aes(color = as.factor(group)))+
geom_mark_ellipse(aes(fill = as.factor(group)), expand = unit(0.5,"mm"))+
theme(legend.position = "none")
|
Output:
Like Article
Suggest improvement
Share your thoughts in the comments
Please Login to comment...