How to annotate a plot in ggplot2 in R ?
Last Updated :
20 Dec, 2023
In this article, we will discuss how to annotate functions in R Programming Language in ggplot2 and also read the use cases of annotate.
What is annotate?
An annotate function in R can help the readability of a plot. It allows adding text to a plot or highlighting a specific portion of the curve. The most common form of annotation is text. Let us first plot a regular plot without any annotation so that the difference is apparent.
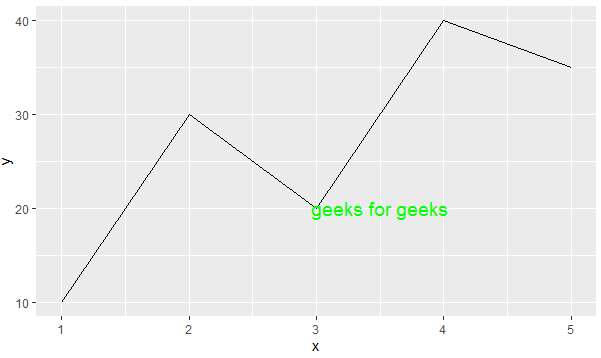
Method 1: Using geom_text()
This allows annotating only text to a plot. This function along with the required parameters is added to the plot.
Syntax:
geom_text(data, x, y, label)
Parameter:
- data: dataframe in consideration
- x: x coordinate of text
- y: y coordinate of text
- label: text
To annotate using this function, first, a dataframe of the values is created and then the values to geom_title() are passed with reference to the dataframe so created.
R
library("ggplot2")
x<-c(1, 2, 3, 4, 5)
y<-c(10, 30, 20, 40, 35)
df<-data.frame(x, y)
ann_text<-data.frame(
x = 4, y = 20,
label = "geeks for geeks"
)
ggplot(df, aes(x,y))+geom_line()+
geom_text(data = ann_text,
aes( x=x, y=y, label=label),
color="green", size=10)
|
Output:

annotate in R
Method 2: Using geom_label()
This function is used to add labels i.e. text is framed in the plot, but since it does the job of adding an annotation this can be considered as one alternative.
Syntax:
geom_text(data, x, y, label)
Parameter:
- data: dataframe in consideration
- x: x coordinate of text
- y: y coordinate of text
- label: text
This method is similar to the above one, except the output produced for this will be treated as a label instead of a regular text, and will have a boundary around it.
R
library("ggplot2")
x<-c(1, 2, 3, 4, 5)
y<-c(10, 30, 20, 40, 35)
df<-data.frame(x, y)
ann_text<-data.frame(
x = 4, y = 20,
label="geeks for geeks"
)
ggplot(df,aes(x,y))+geom_line()+
geom_label(data = ann_text,
aes( x = x, y = y, label=label),
color="green", size=8)
|
Output:

annotate in R
Method 3: Using annotate function in R
annotate() function is most the commonly used function to add annotations to a plot. This not only allows text but also shapes to be displayed on the plot.
Syntax:
annotate(type, x, y,)
Parameter:
- type: type of annotation
- x: x coordinate
- y: y coordinate
To annotate a text to the plot pass the “text” as type and in the label argument, pass the text to be annotated.
R
library("ggplot2")
x<-c(1, 2, 3, 4, 5)
y<-c(10, 30, 20, 40, 35)
df<-data.frame(x,y)
ggplot(df,aes(x,y))+geom_line()+annotate(
"text", x=3.5, y=20, label="geeks for geeks",
color="green", size=5)
|
Output:
To annotate a shape to the plot, the type argument is passed with the required type and then coordinates are set accordingly.
Add shapes with annotate function in R
R
x <- c(1, 2, 3, 4, 5)
y <- c(10, 30, 20, 40, 35)
df <- data.frame(x, y)
p <- ggplot(df, aes(x, y)) +
geom_point() +
geom_line()
p + annotate("rect", xmin = 2, xmax = 4, ymin = 15, ymax = 40,
fill = "lightgreen", color = "blue", alpha = 0.5) +
geom_segment(x = 2, xend = 4, y = 15, yend = 40,
arrow = arrow(length = unit(0.3, "inches")),
color = "red")
|
Output:

annotate in R
the rectangle and the arrow are added within the same ggplot() , ensuring that they appear on the same plot. The + operator is used to concatenate the different layers of the plot.
Add a point and a range using annotate function in R
R
library(ggplot2)
x <- c(1, 2, 3, 4, 5)
y <- c(10, 30, 20, 40, 35)
df <- data.frame(x, y)
p <- ggplot(df, aes(x, y)) +
geom_point() +
geom_line() +
geom_point(aes(x = 3, y = 20), color = "green", size = 3) +
geom_errorbar(aes(x = 3, ymin = 18, ymax = 22),
color = "purple", width = 0.2)
print(p)
|
Output:

annotate in R
geom_point() adds a green point at coordinates (3, 20).
geom_errorbar() adds error bars to indicate a range. The ymin and ymax aesthetics define the range, and width controls the width of the error bars.
Like Article
Suggest improvement
Share your thoughts in the comments
Please Login to comment...