How to Adjust the Position of a Matplotlib Colorbar?
Last Updated :
23 Nov, 2021
A colorbar is a bar that has various colors in it and is placed along the sides of the Matplotlib chart. It is the legend for colors shown in the chart. By default, the position of the Matplotlib color bar is on the right side. The position of the Matplotlib color bar can be changed according to our choice by using the functions from Matplotlib AxesGrid Toolkit. The placing of inset axes is similar to that of legend, the position is modified by providing location options concerning the parent box.
Syntax: fig.colorbar(cm.ScalarMappable(norm=norm, cmap=cmap), ax=ax)
| Attribute |
Description |
| cax |
Axes into which the colorbar will be drawn. |
| ax |
Parent axes from which space for a new colorbar axes are stolen. If a list of axes is given they are resized to make room for colorbar axes. |
| colorbar |
Use set_label to set the label to the colorbar |
| pad |
relative subplot gap or fraction of original axes between colorbar and new image axes |
| LogNorm |
Converting number arguments or color to RGBA |
| figsize |
2-tuple of floats. Figure Dimension(width, height) in inches |
| add_subplot |
Add an Axes to the figure as part of a subplot arrangement |
| add_axes |
Present in figure module of matplotlib library used to add axes to figure |
| imshow |
The convention used in image processing: the origin is in the top left corner. |
| pcolor |
Creating a pseudocolor plot with a non-regular rectangular grid. |
Installation of Matplotlib colorbar
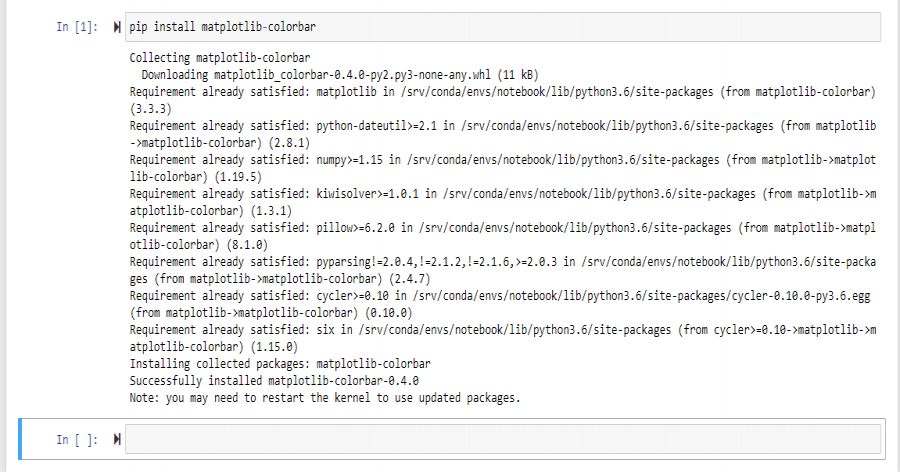
To install the matplotlib colorbar directly execute the following command on Jupyter Notebook or Visual Studio Code to get the results, Matplotlib-colorbar package is installed in order to generate using the colorbar argument. Here, matplotlib.pyplot is used to create a colorbar in a simpler way.
pip install matplotlib-colorbar
Installation of Matplotlib Colorbar
Another way to create a colorbar using Matplotlib is by importing the matplotlib package and then creating the colorbar.
Python3
import matplotlib.pyplot as plt
import numpy as np
from matplotlib.colors import LogNorm
Z = np.random.rand(5, 20)
fig, ax0 = plt.subplots()
ax0.pcolor(Z)
ax0.set_title('Matplotlib-colorbar')
plt.show()
|
Output:

Example 1: Position of Matplotlib colorbar on Right Side
Generating a matplotlib chart where the colorbar is positioned on the right side of the chart.
Python3
import numpy as np
import matplotlib.pyplot as plt
from mpl_toolkits.axes_grid1 import make_axes_locatable
np.random.seed(2)
fig, ax = plt.subplots()
im = ax.imshow(np.random.rand(10,10))
ax.set_xlabel('x-axis label')
fig.colorbar(im)
plt.show()
|
Output:

Example 2: Position of Matplotlib colorbar on Left
Generating a Matplotlib chart where the colorbar is positioned on the left of the chart. Here, the axes locations are set manually and the colorbar is linked to the existing plot axis using the keyword ‘location’. Location argument is used on color bars that reference multiple axes in a list, if you put your one axis in a list then the argument can be used here.
Python3
import matplotlib.pyplot as plt
import numpy as np
fig = plt.figure()
ax = fig.add_subplot(111)
axp = ax.imshow(np.random.randint(0, 10,( 10, 10)))
ax.set_title('Colorbar on left')
cb = plt.colorbar(axp ,ax = [ax], location = 'left')
plt.show()
|
Output:

This is a simple way to generate a colorbar and ensure it is on its own axis. Then the position of colorbar is specified using ‘cax’ parameter where axes are given for the color bar to be drawn.
Python3
import numpy as np
import matplotlib.pyplot as plt
from mpl_toolkits.axes_grid1 import make_axes_locatable
np.random.seed(1)
fig = plt.figure()
ax = fig.add_subplot(111)
axp = ax.imshow(np.random.randint(0, 10, (10, 10)))
ax.set_title('Colorbar on left')
cbaxes = fig.add_axes([0.1, 0.1, 0.03, 0.8])
cb = plt.colorbar(axp, cax = cbaxes)
plt.show()
|
Output:
Example 3: Position of Matplotlib colorbar below the Chart
To position, the Matplotlib Colorbar below the chart then execute the following command,
Python3
import numpy as np
import matplotlib.pyplot as plt
from mpl_toolkits.axes_grid1 import make_axes_locatable
np.random.seed(2)
fig, ax = plt.subplots()
im = ax.imshow(np.random.rand(10,10))
ax.set_xlabel('x-axis label')
divider = make_axes_locatable(ax)
cax = divider.new_vertical(size='5%', pad=0.6, pack_start = True)
fig.add_axes(cax)
fig.colorbar(im, cax = cax, orientation = 'horizontal')
plt.show()
|
Output:

Pad argument creates padding between the x-axis of the chart and colorbar. Higher the value for the pad, the colorbar is away from the x-axis. To move colorbar relative to the subplot use the pad argument to fig.colorbar.
Python3
import matplotlib.pyplot as plt
import numpy as np; np.random.seed(1)
fig, ax = plt.subplots(figsize=(4,4))
im = ax.imshow(np.random.rand(11,16))
ax.set_xlabel("x label")
fig.colorbar(im, orientation="horizontal", pad = 0.4)
plt.show()
|
Output:

Use the instance of make_axes_locatable to divide axes and create new axes which are aligned to the image plot. Pad argument will allow setting space between two axes:
Python3
import matplotlib.pyplot as plt
from mpl_toolkits.axes_grid1 import make_axes_locatable
import numpy as np; np.random.seed(1)
fig, ax = plt.subplots(figsize = (4,4))
im = ax.imshow(np.random.rand(11,16))
ax.set_xlabel("x label")
divider = make_axes_locatable(ax)
cax = divider.new_vertical(size = "5%",
pad = 0.7,
pack_start = True)
fig.add_axes(cax)
fig.colorbar(im, cax = cax, orientation = "horizontal")
plt.show()
|
Output:

Example 4: Position of Colorbar above Chart
To position, the Matplotlib Colorbar below the chart then execute the following command,
Python3
import numpy as np
import matplotlib.pyplot as plt
from mpl_toolkits.axes_grid1 import make_axes_locatable
np.random.seed(1)
fig, ax = plt.subplots()
im = ax.imshow(np.random.rand(15, 15))
ax.set_xlabel('x-axis label')
ax.set_title('Colorbar above chart')
divider = make_axes_locatable(ax)
cax = divider.new_vertical(size = '5%', pad = 0.5)
fig.add_axes(cax)
fig.colorbar(im, cax = cax, orientation = 'horizontal')
plt.show()
|
Output:

Like Article
Suggest improvement
Share your thoughts in the comments
Please Login to comment...