How to add text in a heatmap cell annotations using seaborn in Python ?
Last Updated :
24 Jan, 2021
Prerequisite: Seaborn heatmap
Heatmap is defined as a graphical representation of data using colors to visualize the value of the matrix. In this, to represent more common values or higher activities brighter colors basically reddish colors are used and to represent less common or activity values, darker colors are preferred. Heatmap is also defined by the name of the shading matrix. Heatmaps in Seaborn can be plotted by using the seaborn.heatmap() function.
Syntax: seaborn.heatmap(data, *, vmin=None, vmax=None, cmap=None, center=None, annot_kws=None, linewidths=0, linecolor=’white’, cbar=True, **kwargs)
Important Parameters:
- data: 2D dataset that can be coerced into an ndarray.
- vmin, vmax: Values to anchor the colormap, otherwise they are inferred from the data and other keyword arguments.
- cmap: The mapping from data values to color space.
- center: The value at which to center the colormap when plotting divergent data.
- annot: If True, write the data value in each cell.
- fmt: String formatting code to use when adding annotations.
- linewidths: Width of the lines that will divide each cell.
- linecolor: Color of the lines that will divide each cell.
- cbar: Whether to draw a colorbar.
All the parameters except data are optional.
Returns: An object of type matplotlib.axes._subplots.AxesSubplot
Heatmap annotations are a great way of showing additional information about rows and columns in the heatmap. Generally, to show data values over heatmap we set annot parameter to True but if you want to add text to cell annotations it can be done in the following ways –
Approach 1:
- Import module
- Create data or load dataset
- Create another array-like data having text-values you want to show on heatmap (with the same shape as your data)
- Give this array-like data as a value to annot parameter of the heatmap.
- fmt parameter of the heatmap is necessary if you want to add non-numeric values. This parameter is used to add String formatting code to use when adding annotations.
- Draw heatmap
- Display plot
Example:
Python3
import numpy as np
import seaborn as sns
import matplotlib.pyplot as plt
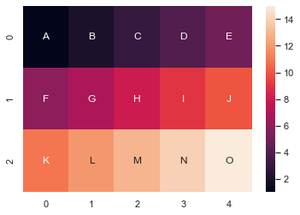
data = np.array([[1, 2, 3, 4, 5], [6, 7, 8, 9, 10],
[11, 12, 13, 14, 15]])
text = np.array([['A', 'B', 'C', 'D', 'E'], ['F', 'G', 'H', 'I', 'J'],
['K', 'L', 'M', 'N', 'O']])
fig, ax = plt.subplots()
ax = sns.heatmap(data, annot=text, fmt="")
|
Output :
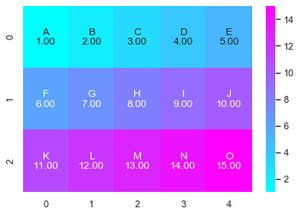
If you want to show text along with data values you have to create a custom annot by concatenating these two values.
Approach 2:
- Import module
- Create or load data
- Declare a data array
- Reshape data array and text array into 1D using np.flatten().
- Then zip them together to iterate over both text and value.
- Use formatted strings to create customized new value.
- Return a reshaped array of the same size containing customized values.
- Create heatmap
- Display plot
Example :
Python3
import numpy as np
import seaborn as sns
import matplotlib.pyplot as plt
data = np.array([[1, 2, 3, 4, 5], [6, 7, 8, 9, 10],
[11, 12, 13, 14, 15]])
text = np.array([['A', 'B', 'C', 'D', 'E'],
['F', 'G', 'H', 'I', 'J'], ['K', 'L', 'M', 'N', 'O']])
formatted_text = (np.asarray(["{0}\n{1:.2f}".format(
text, data) for text, data in zip(text.flatten(), data.flatten())])).reshape(3, 5)
fig, ax = plt.subplots()
ax = sns.heatmap(data, annot=formatted_text, fmt="", cmap="cool")
|
Output :
Like Article
Suggest improvement
Share your thoughts in the comments
Please Login to comment...