How to Add Superscripts and Subscripts to Plots in R?
Last Updated :
28 Nov, 2021
Plots can be used to create and display numerical values or data points. The x and y axes labels or titles are used to depict the labels to the plot data. These labels can create either subscript or superscript symbols within them. This can be done using various base R methods :
Method 1: Adding superscripts to plot
The superscripts can be added to the x or y axes labels or titles of the plot. These can be added using the ^ operator which is appended to the character string created in the plot() method. The superscript operator can be created using the expression method.
Syntax:
expression(str^val)
Parameters :
- str – The character string to create
- val – The value to raise the character string by
Example:
Here we are going to create a plot with numbers from 1 to 6 with power of 2 as an expression.The string “Numbers” is combined with a subscript ^2 formatted with ^ symbol.
R
numb < - 1: 6
plot(numb, xlab=expression("Numbers" ^ 2))
|
Output:

Method 2: Adding subscripts to plot
The subscripts can be added to the x or y axes labels or titles of the plot. These can be added using the [] operator which is appended to the character string created in the plot() method. The subscript operator can be created using the expression method.
Syntax:
expression(str[val])
Parameters :
- str – The character string to create
- val – The value to create the subscript the character string by
Example:
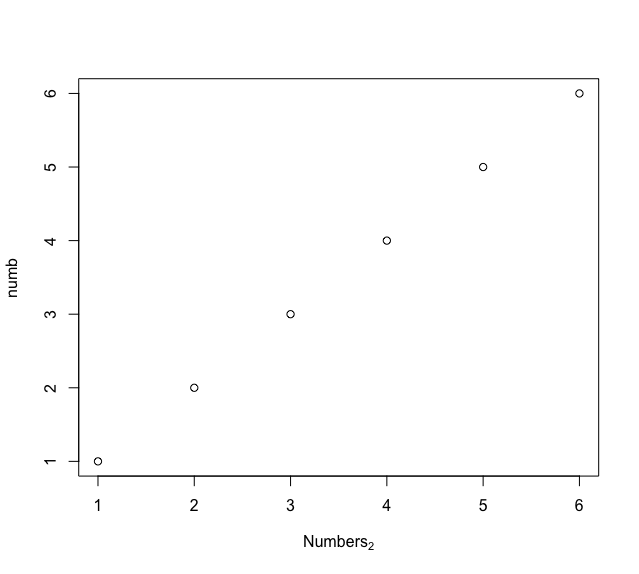
Here we are going to plot an expression [2] with the given numbers.The string “Numbers” is combined with a subscript [2] enclosed in braces.
R
numb < - 1: 6
plot(numb, xlab=expression("Numbers"[2]))
|
Output:
Method 3: Adding both superscripts and subscripts to plot
A combination of subscripts or superscripts can be appended to the plot strings using the ^ or [] operators. The * sign is appended each time the character string breaks into a part.
Example:
Here we are plot an expression log”[a]*”10″^2 for the integers 1 to 6. The string “log” is combined with the subscript [a] and then combined with the string “10” along with the superscript 2 formatted with ^ symbol.
R
numb < - 1: 6
plot(numb, xlab=expression("log"[a]*"10" ^ 2))
|
Output:

Like Article
Suggest improvement
Share your thoughts in the comments
Please Login to comment...