How To Add Regression Line Per Group with Seaborn in Python?
Last Updated :
25 Nov, 2020
In this article, we will learn how to add a regression line per group with Seaborn in Python. Seaborn has multiple functions to form scatter plots between two quantitative variables. For example, we can use lmplot() function to make the required plot.
What is Regression Line?
A regression line is just one line that most closely fits the info (in terms of getting the littlest overall distance from the road to the points). Statisticians call this system for locating the best-fitting line an easy rectilinear regression analysis using the smallest amount squares method.
Steps Required
- Import Library.
- Import or create data.
- Use lmplot method. This method is used to add a regression line per group by simply adding the hue parameter with the categorical variable name.
- Use different arguments for better visualization.
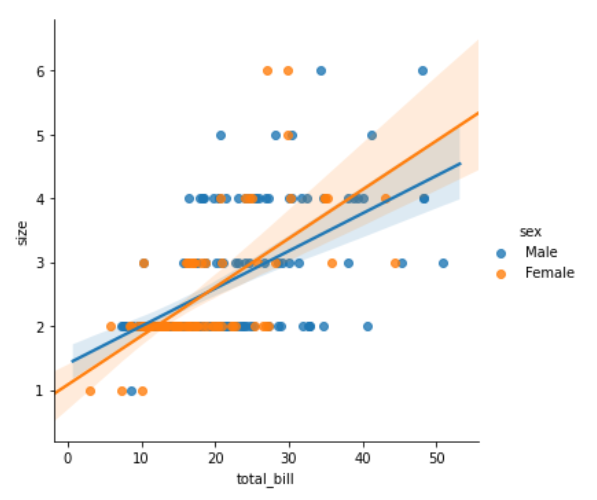
Example 1:
Python3
import seaborn
tip = seaborn.load_dataset('tips')
seaborn.lmplot(x="total_bill",
y="size",
hue="sex",
data=tip)
|
Output:
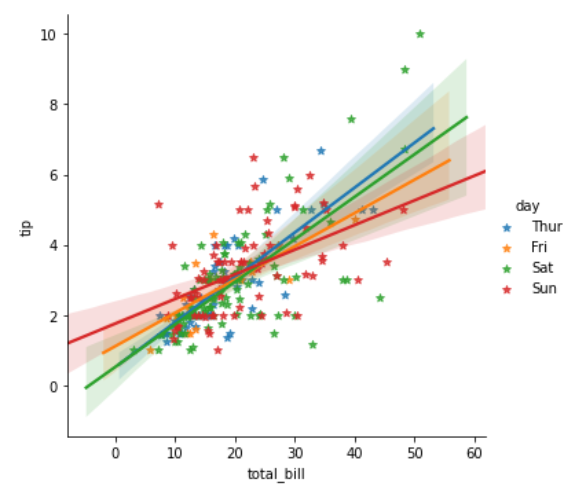
Example 2:
Python3
import seaborn
tip = seaborn.load_dataset('tips')
seaborn.lmplot(x="total_bill",
y="tip",
hue="day",
markers='*',
data=tip)
|
Output:
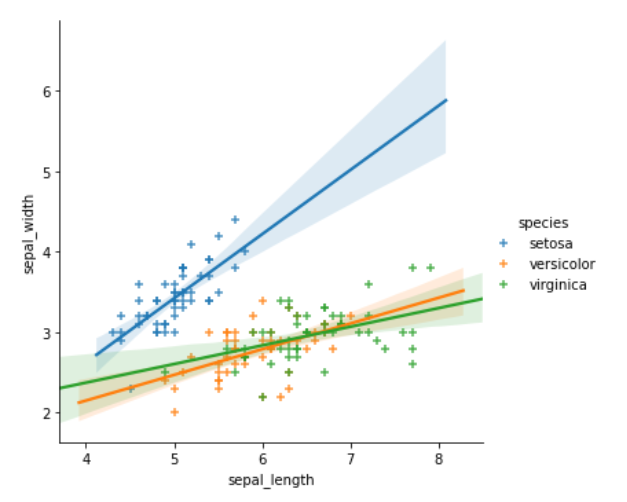
Example 3:
Python3
import seaborn
iris = seaborn.load_dataset('iris')
seaborn.lmplot(x="sepal_length",
y="sepal_width",
hue="species",
markers='+',
data=iris)
|
Output:
Like Article
Suggest improvement
Share your thoughts in the comments
Please Login to comment...