How to Add Multiple Axes to a Figure in Python
Last Updated :
04 Sep, 2021
In this article, we are going to discuss how to add multiple axes to a figure using matplotlib in Python. We will use the add_axes() method of matplotlib module to add multiple axes to a figure.
Step-by-step Approach:
- Import required modules
- After importing matplotlib, create a variable fig and equal it to plt.figure(). This will create an empty object. It will be empty initially and later it will be populated with data.
- After the creation of an empty object, we will add the axes to this figure. Since we are adding multiple axis to this figure, we need to add certain values to the axes such as left, bottom, width, height using a function add_axes(). The values of left, bottom, width and height inside add_axes() will range from 0 to 1.
- After creating the 1st axes, add the second axes. The values now will be smaller as compared to 1st axes because it is to be made inside the bigger one.
- Executing the lines without plotting any data will provide a figure with multiple axis and with no plots.
Below are some programs based on the above stepwise approach:
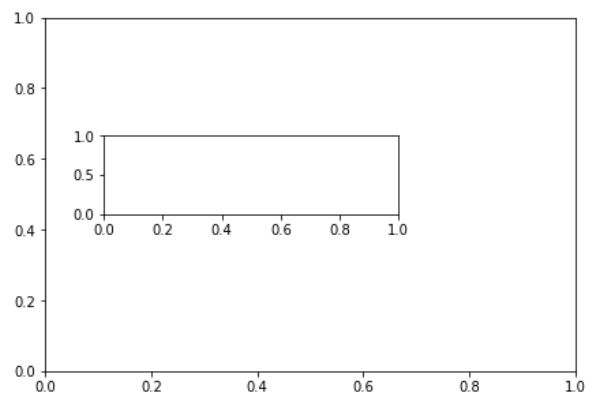
Example 1:
The below program depicts how to add multiple axes to a plot.
Python3
import matplotlib.pyplot as plt
fig = plt.figure()
axes1 = fig.add_axes([0.1, 0.1, 0.9, 0.9])
axes2 = fig.add_axes([0.2, 0.5, 0.5, 0.2])
|
Output:
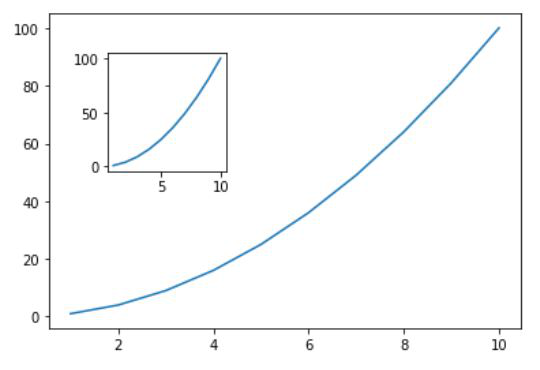
Example 2:
If we want to add multiple axes to a figure with a plotted graph, then we need to add some values of x and y demonstrated below and plot those points in the graph.
Python3
import matplotlib.pyplot as plt
fig = plt.figure()
axes1 = fig.add_axes([0.1, 0.1, 0.8, 0.8])
axes2 = fig.add_axes([0.2, 0.5, 0.2, 0.3])
x = [1, 2, 3, 4, 5, 6, 7, 8, 9, 10]
y = [x**2 for x in x]
axes1.plot(x, y)
axes2.plot(x, y)
fig.show()
|
Output:
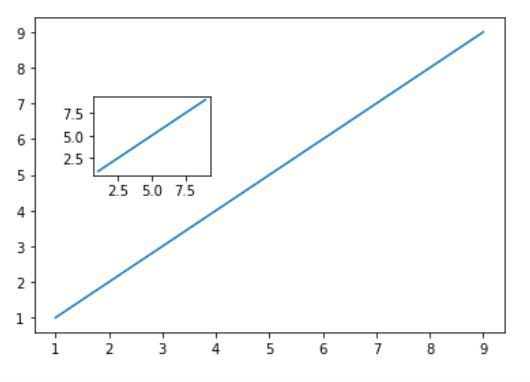
Example 3:
Python3
import matplotlib.pyplot as plt
fig = plt.figure()
axes1 = fig.add_axes([0.1, 0.1, 0.8, 0.8])
axes2 = fig.add_axes([0.2, 0.5, 0.2, 0.2])
x = [1, 2, 3, 4, 5, 6, 7, 8, 9]
y = [1, 2, 3, 4, 5, 6, 7, 8, 9]
axes1.plot(x, y)
axes2.plot(x, y)
fig.show()
|
Output:
Like Article
Suggest improvement
Share your thoughts in the comments
Please Login to comment...