How To Add Mean Line to Ridgeline Plot in R with ggridges?
Last Updated :
22 Dec, 2022
In this article, we will discuss how to add a mean line to the Ridgeline plot in R Programming Language with the ggridges package.
Ridgeline plot helps us to visualize multiple distributions or a distribution that changes a quantifiable variable. The name “ridgeline” comes from its appearance as an overlapping mountain range. Firstly, we will create a basic ridgeline plot using the diamonds dataset that is a prebuilt data frame in R language natively.
Syntax:
ggplot(dataframe, aes(x , y , fill)) + geom_density_ridges()
Example:
Here is a basic ridgeline plot made using the diamonds dataset. Here, we have used the price and cut variable of the dataset to plot the ridgeline plot. We have used geom_density_ridges() function with the ggplot() function to create the ridgeline plot.
R
library(ggridges)
library(ggplot2)
ggplot(diamonds, aes(x = price, y = cut, fill=cut)) +
geom_density_ridges()
|
Output:
Here, is a basic ridgeline plot plotted using the diamonds dataset. Here, the fill parameter is used to color the plot according to the cut of the diamond.

Adding the mean line
The ridgeline plot with the vertical mean line for each category helps us to understand the variation of the mean over a category of data. To add the mean line to the ridgeline plot with the ggridges, we need to use quantile_lines and quantile_fun parameters inside the geom_density_ridges() function from the ggridges package.
Syntax:
plot+ geom_density_ridges(quantile_lines=TRUE, quantile_fun=function(value ,…)mean(value))
- quantile_lines: This determines if we want a quantile line or not. It is a boolean.
- quantile_fun: It is a function that determines the position of the line.
Example:
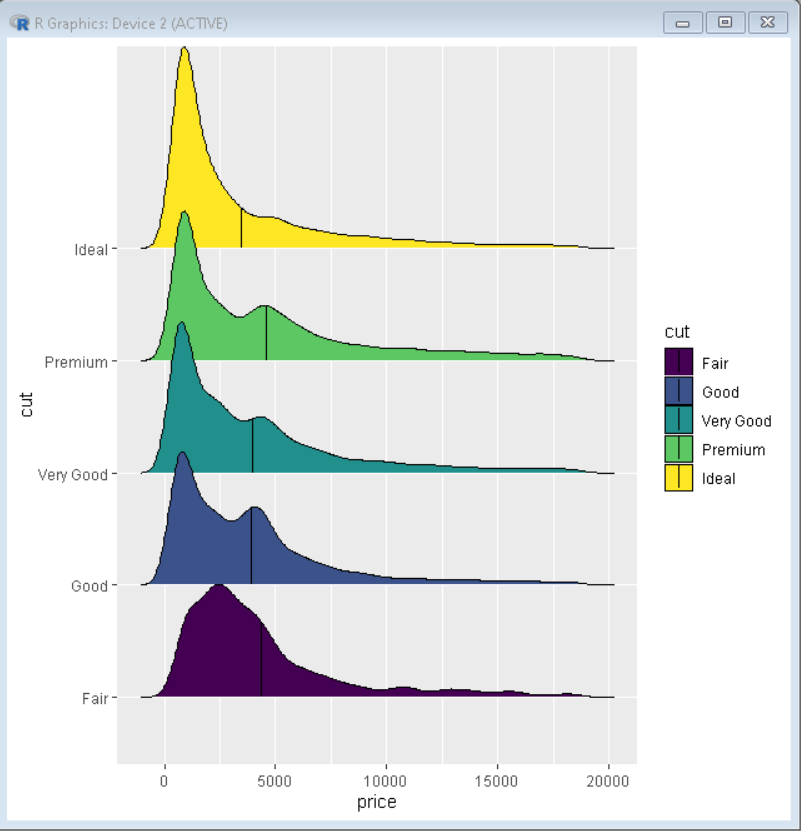
Here, is a ridgeline plot with a mean line through it. Here, the quantile_lines parameter has been set true and in quantile_fun is the mean function with the parameter being price. This creates a line that passes through the mean price in the plot.
R
library(ggridges)
library(ggplot2)
ggplot(diamonds, aes(x = price, y = cut, fill=cut)) +
geom_density_ridges(quantile_lines=TRUE, quantile_fun=function(price,...)mean(price))
|
Output:
Here is a ridgeline plot with a line through the mean of prices of diamond of each cut. This helps us visualize the mean trend in each category of data.
Like Article
Suggest improvement
Share your thoughts in the comments
Please Login to comment...