How to add Matplotlib graph in Kivy ?
Last Updated :
05 Apr, 2021
In this article, we will discuss how to add matplotlib graph in the kivy app.
Approach:
- Import matplotlib pyplot
- Import numpy
- Import FigureCanvas KivyAgg
- Import kivy app
- Import kivy builder
- Create App class
- Return builder string
- Run an instance of the class
Below is the Implementation.
Python3
from matplotlib import pyplot as plt
import numpy as np
from kivy.garden.matplotlib import FigureCanvasKivyAgg
from kivy.app import App
from kivy.lang import Builder
class uiApp(App):
def build(self):
self.str = Builder.load_string(
)
signal = [7, 89.6, 45.-56.34]
signal = np.array(signal)
plt.plot(signal)
plt.xlabel('Time(s)')
plt.ylabel('signal (norm)')
plt.grid(True, color='lightgray')
self.str.layout.add_widget(FigureCanvasKivyAgg(plt.gcf()))
return self.str
uiApp().run()
|
Output:
Note: When you run the below code this may throw the error given below
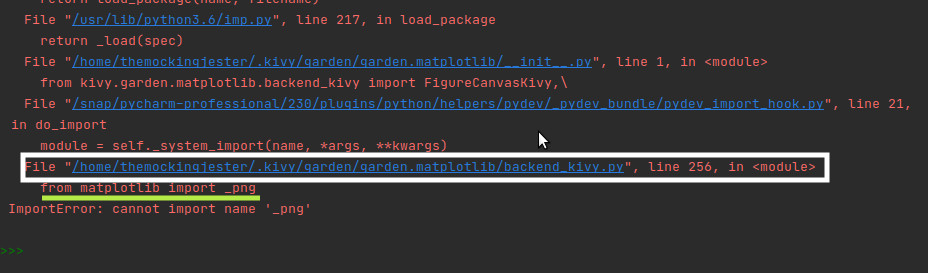
What you have to do is open the file given in the white box by clicking on file while holding ctrl key and comment line underlined by green color in that file and hit save now you will be able to run it!!
Like Article
Suggest improvement
Share your thoughts in the comments
Please Login to comment...