How to Add Leader Lines in Excel?
Last Updated :
03 Mar, 2022
Leader Lines are the lines that connect data labels and data points in a chart. Before excel 2013 leader lines were available only for pie charts but after excel 2013 update leader lines could be built for any type of chart. Leader lines make complex charts more understandable. Below is a pie chart format is shown,

Steps to make Leader lines in a chart
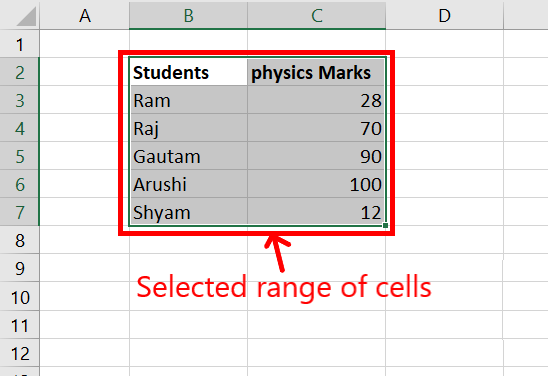
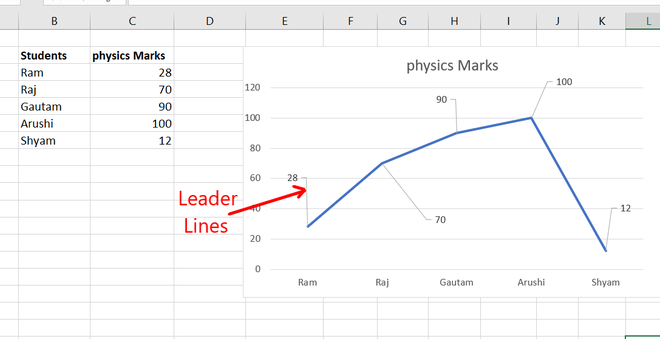
Given a data set of students and their physics marks. Make a line chart and plot their marks using leader lines.

Step 1: Select a range of cells for which you want to make a line chart.
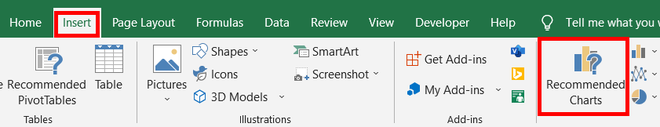
Step 2: Go to Insert Tab and select Recommended Charts. A dialogue box name Insert Chart appears.
Step 3: Click on All Charts and select Line. Click Ok.
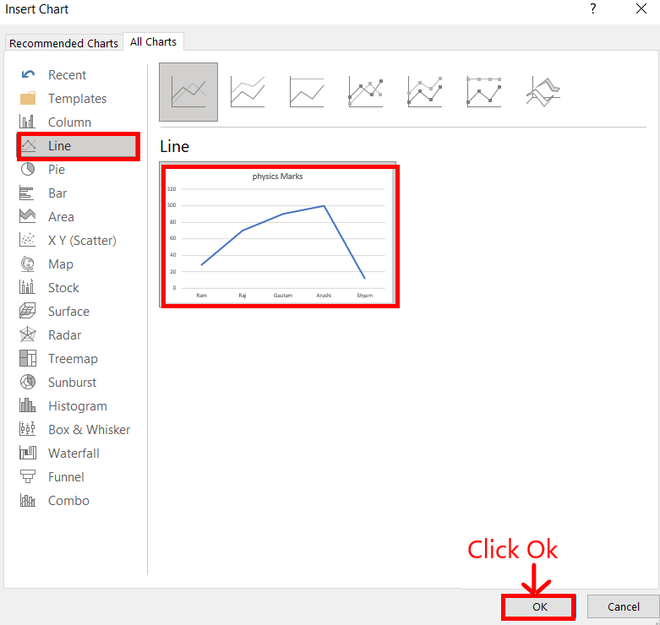
Step 4: A line chart is embedded in the worksheet.

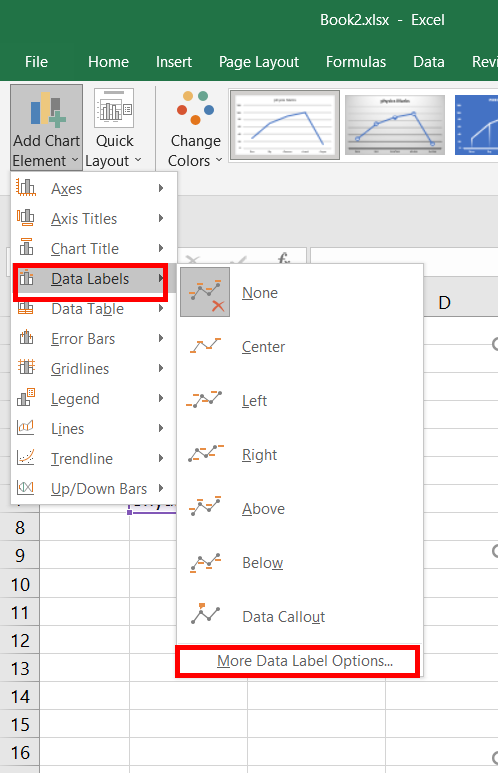
Step 5: Go to Chart Design Tab and select Add Chart Element.

Step 6: Hover on the Data Labels option. Click on More Data Label Options…
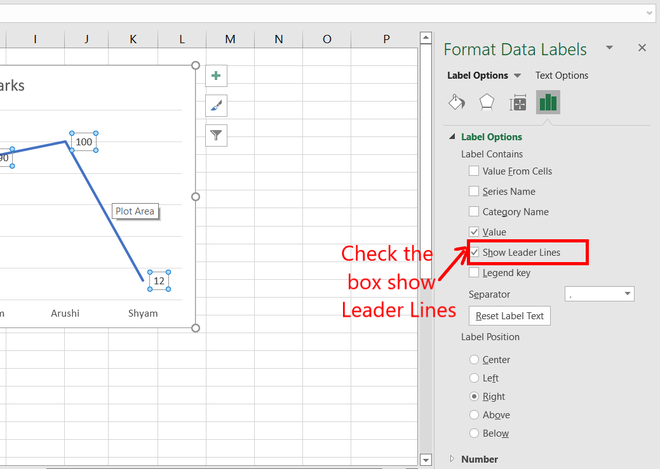
Step 7: Format Data Labels emerge on the right-most side of the worksheet. Check the box called Show Leader Lines. Now you can access leader lines.
Step 8: The leader lines will help connect data labels and data points.
Like Article
Suggest improvement
Share your thoughts in the comments
Please Login to comment...