How to Add Labels Over Each Bar in Barplot in R?
Last Updated :
18 Oct, 2021
In this article, we will see how to add labels over each bar in barplot in R Programming language.
To add labels on top of each bar in Barplot in R we use the geom_text() function of the ggplot2 package.
Syntax: plot+ geom_text(aes(label = value, nudge_y )
Parameters:
- value: value field of which labels have to display.
- nudge_y: distance shift in the vertical direction for the label
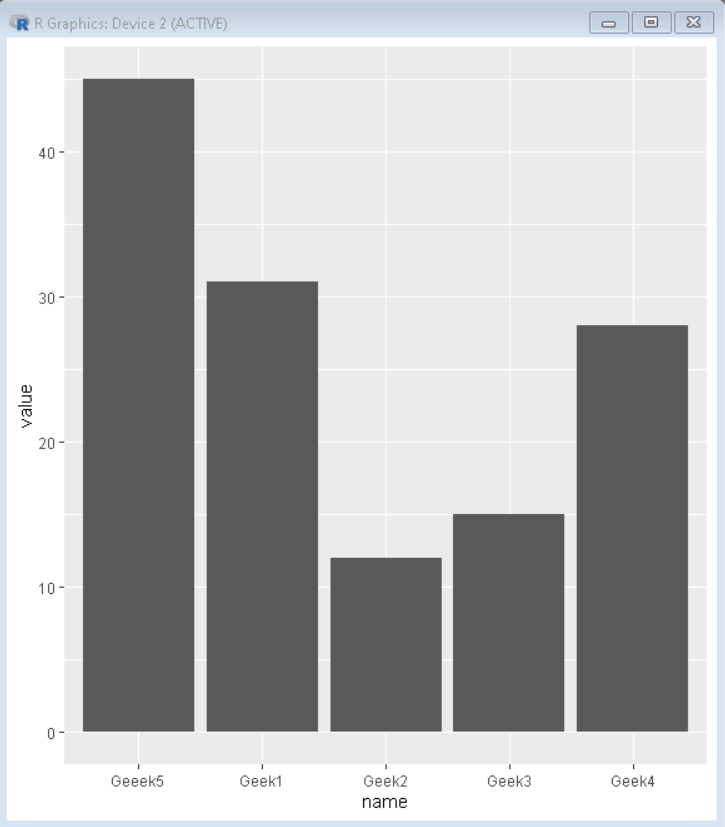
Creating a basic barplot with no labels on top of bars:
In the below example, we will create dataframe and then plot a barplot with this dataframe with no labels.
R
set.seed(5642)
sample_data <- data.frame(name = c("Geek1","Geek2",
"Geek3","Geek4",
"Geeek5") ,
value = c(31,12,15,28,45))
library("ggplot2")
plot<-ggplot(sample_data,
aes(name,value)) +
geom_bar(stat = "identity")
plot
|
Output:
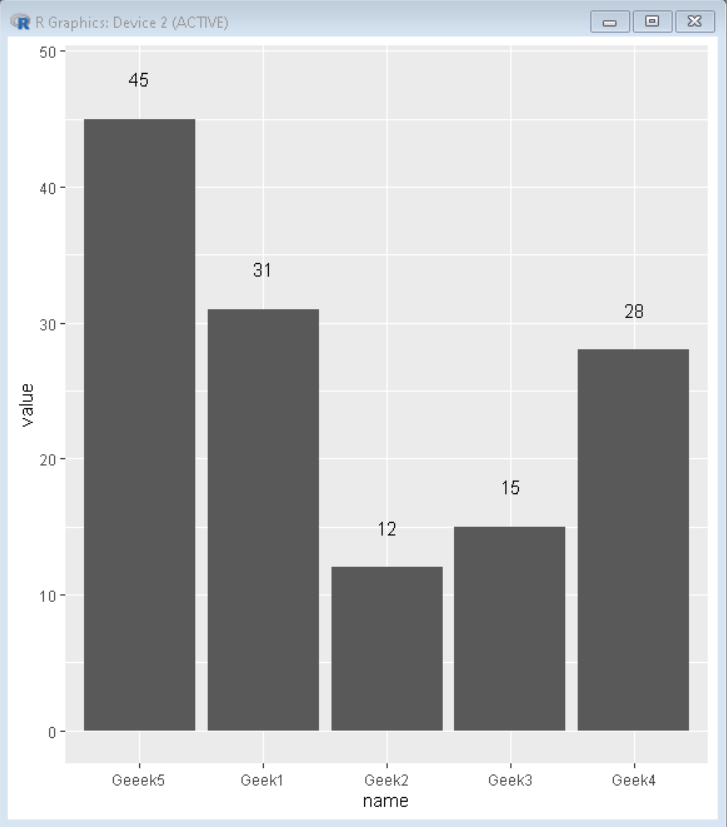
Get labels on the top of bars
In the below example, we will add geom_text() in the plot to get labels on top of each bar.
R
set.seed(5642)
sample_data <- data.frame(name = c("Geek1","Geek2",
"Geek3","Geek4",
"Geeek5") ,
value = c(31,12,15,28,45))
library("ggplot2")
plot<-ggplot(sample_data,
aes(name,value)) +
geom_bar(stat = "identity")+
geom_text(aes(label = signif(value)), nudge_y = 3)
plot
|
Output:
Multiple labels on the top of bars
By adjusting the nudge_y values you can add multiple label on top of bars.
R
set.seed(5642)
sample_data <- data.frame(name = c("Geek1","Geek2",
"Geek3","Geek4",
"Geeek5") ,
value = c(31,12,15,28,45))
library("ggplot2")
plot<-ggplot(sample_data,
aes(name,value)) +
geom_bar(stat = "identity")+
geom_text(aes(label = signif(value)), nudge_y = 1) +
geom_text(aes(label = name), nudge_y = 3)
plot
|
Output:

Like Article
Suggest improvement
Share your thoughts in the comments
Please Login to comment...