How to Add Labels in a Plot using Python?
Last Updated :
06 Dec, 2022
Prerequisites: Python Matplotlib
In this article, we will discuss adding labels to the plot using Matplotlib in Python. But first, understand what are labels in a plot. The heading or sub-heading written at the vertical axis (say Y-axis) and the horizontal axis(say X-axis) improves the quality of understanding of plotted stats.
Example: Let’s create a simple plot
Python
import matplotlib
import matplotlib.pyplot as plt
import numpy as np
y = np.array([3, 8, 1, 10])
plt.plot(y)
plt.show()
|
Output:
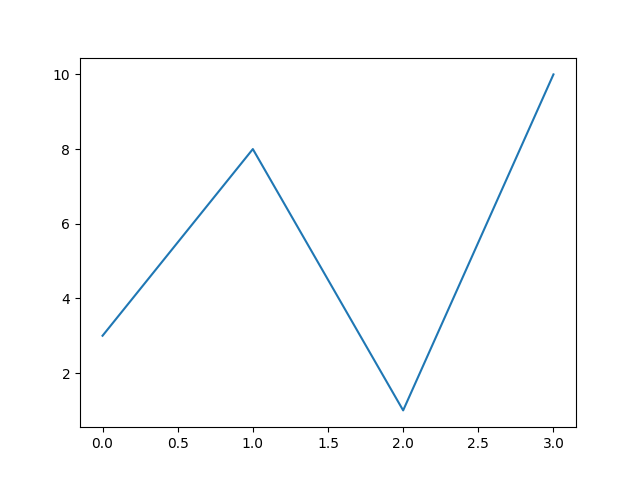
Plot without Labels or Title
Creating Labels for a Plot
By using pyplot() function of library we can add xlabel() and ylabel() to set x and y labels.
Example: Let’s add Label in the above Plot
Python
import matplotlib
import matplotlib.pyplot as plt
import numpy as np
x = np.array([0, 1, 2, 3])
y = np.array([3, 8, 1, 10])
plt.plot(x, y)
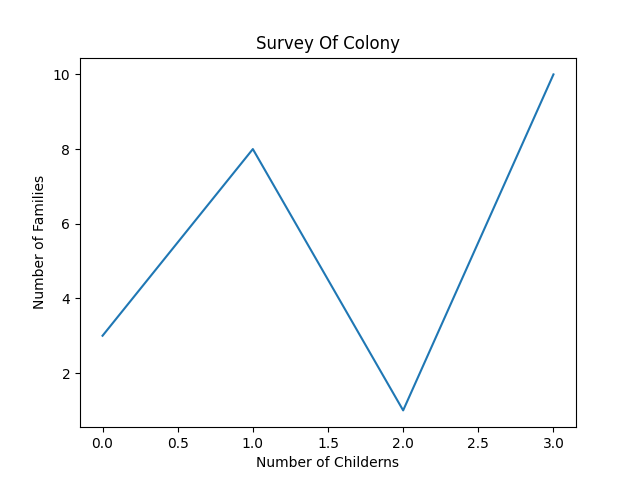
plt.xlabel("Number of Childrens")
plt.ylabel("Number of Families")
plt.show()
|
Output:

Plot with Labels
If you would like to make it more understandable, add a Title to the plot, by just adding a single line of code.
plt.title("Survey Of Colony")
Example:
Python3
import matplotlib
import matplotlib.pyplot as plt
import numpy as np
x = np.array([0, 1, 2, 3])
y = np.array([3, 8, 1, 10])
plt.plot(x, y)
plt.xlabel("Number of Childrens")
plt.ylabel("Number of Families")
plt.title("Survey Of Colony")
plt.show()
|
Output:
Plot with Title
Set Font Properties for Titles and Labels
In order to make the Plot more attractive use the fontdict parameter in xlabel(), ylabel(), and title() to apply the font properties.
Python
import matplotlib
import matplotlib.pyplot as plt
import numpy as np
x = np.array([0, 1, 2, 3])
y = np.array([3, 8, 1, 10])
form1 = {'family': 'serif', 'color': 'blue', 'size': 20}
form2 = {'family': 'serif', 'color': 'darkred', 'size': 15}
plt.plot(x, y)
plt.xlabel("Number of Childrens", fontdict=form1)
plt.ylabel("Number of Families", fontdict=form1)
plt.title("Survey Of Colony", fontdict=form2)
plt.show()
|
Output:
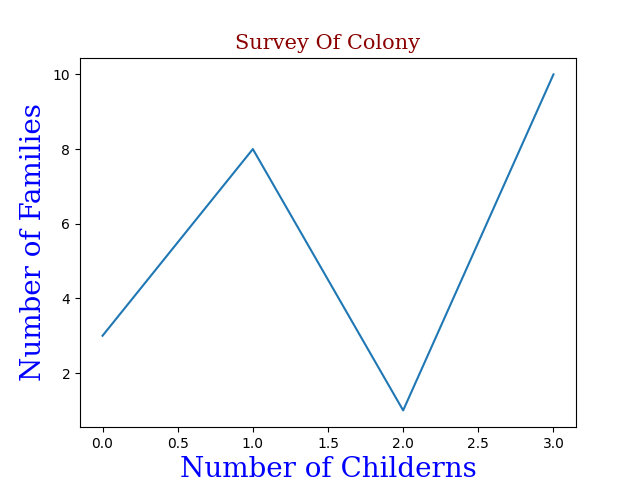
Plot with Font Properties
Like Article
Suggest improvement
Share your thoughts in the comments
Please Login to comment...