How to Add Axes to a Figure in Matplotlib with Python?
Last Updated :
02 Dec, 2020
Matplotlib is a library in Python used to create figures and provide tools for customizing it. It allows plotting different types of data, geometrical figures. In this article, we will see how to add axes to a figure in matplotlib.
We can add axes to a figure in matplotlib by passing a list argument in the add_axes() method.
Syntax: matplotlib.pyplot.figure.add_axes(rect)
Parameters:
rect: This parameter is the dimensions [xmin, ymin, dx, dy] of the new axes. It takes the below elements as arguments in the list:
- xmin: Horizontal coordinate of the lower left corner.
- ymin: Vertical coordinate of the lower left corner.
- dx: Width of the subplot.
- dy: Height of the subplot.
Returns: This method return the axes class depends on the projection used.
Below are some programs which depict how to add axes to a figure in matplotlib:
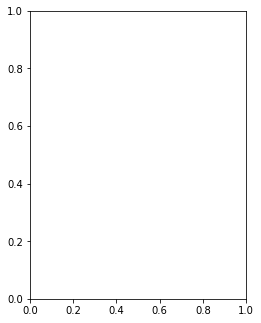
Example 1:
Python3
import matplotlib
fig = matplotlib.pyplot.figure()
axes = fig.add_axes([0.5, 1, 0.5, 1])
fig.show()
|
Output:
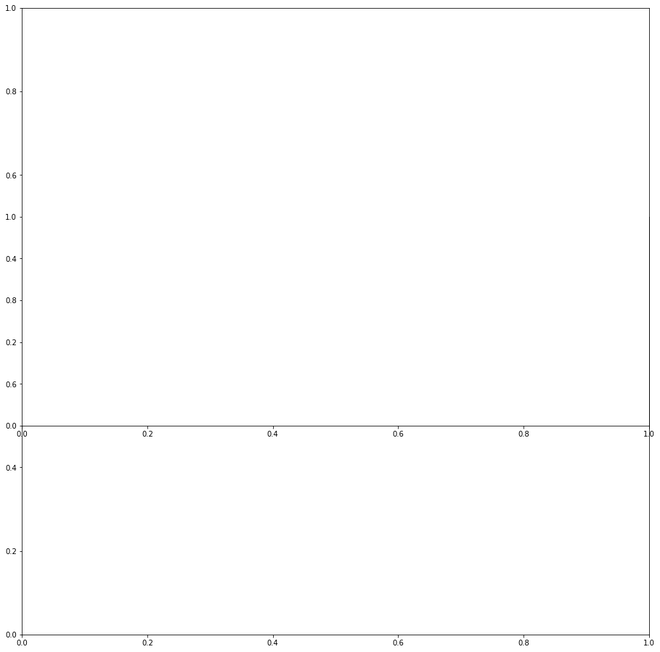
Example 2:
Python3
import matplotlib
fig=matplotlib.pyplot.figure()
axes=fig.add_axes([0,0,2,2])
axes1=fig.add_axes([0,1,2,2])
fig.show()
|
Output:
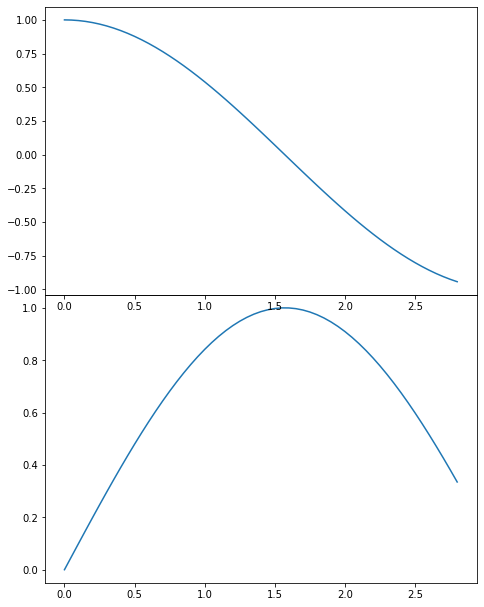
Example 3:
Python3
import matplotlib
import numpy
fig = matplotlib.pyplot.figure()
x = numpy.arange(0, 1.414*2, 0.05)
y1 = numpy.sin(x)
y2 = numpy.cos(x)
axes1 = fig.add_axes([0, 0, 1, 1])
axes1.plot(x, y1)
axes2 = fig.add_axes([0, 1, 1, 1])
axes2.plot(x, y2)
plt.show()
|
Output:
Like Article
Suggest improvement
Share your thoughts in the comments
Please Login to comment...