Hide legend in Bokeh plot
Last Updated :
25 Feb, 2021
Bokeh is a Python interactive data visualization. It renders its plots using HTML and JavaScript. It targets modern web browsers for presentation providing elegant, concise construction of novel graphics with high-performance interactivity. Adding legends to your figures can help to properly describe and define them. Hence, giving more clarity. Legends in Bokeh are simple to implement. They can be basic, automatically grouped, manually mentioned, explicitly indexed and also interactive. In this article we will discuss only how to have the legends completely invisible from the plot.
To achieve the required functionality we have to set the visible property of the bokeh legend to False.
Syntax:
bokeh.legend.visible=False
Approach
- Import module
- Create figure frame
- Plot required graph
- Set legend to invisible
- Display plot
First, let us see how a plot with legend looks like, and then we will set the visibility to false for the same plot.
Example
Python3
import pandas as pd
from bokeh.plotting import figure, output_file, show
from bokeh.sampledata.stocks import AAPL
pic = figure(plot_width=600, plot_height=150, x_axis_type="datetime")
pic.title.text = 'Plot without legend'
for data, name, color in zip([AAPL], ["AAPL"], Spectral4):
df = pd.DataFrame(data)
df['date'] = pd.to_datetime(df['date'])
pic.line(df['date'], df['close'], line_width=2,
color=color, alpha=0.8, legend_label=name)
output_file("hide_legend.html", title="hide_legend.py example")
show(pic)
|
Output
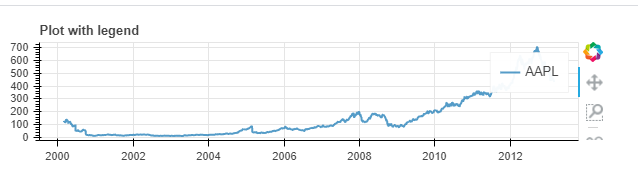
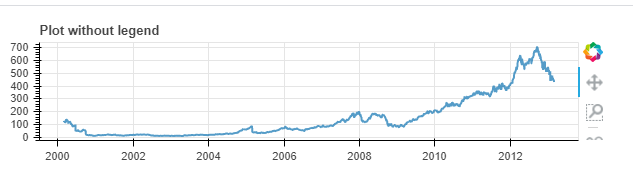
Example: Without legend
Python3
import pandas as pd
from bokeh.plotting import figure, output_file, show
from bokeh.sampledata.stocks import AAPL
pic = figure(plot_width=600, plot_height=150, x_axis_type="datetime")
pic.title.text = 'Plot without legend'
for data, name, color in zip([AAPL], ["AAPL"], Spectral4):
df = pd.DataFrame(data)
df['date'] = pd.to_datetime(df['date'])
pic.line(df['date'], df['close'], line_width=2,
color=color, alpha=0.8, legend_label=name)
pic.legend.visible = False
output_file("hide_legend.html", title="hide_legend.py example")
show(pic)
|
Output
Like Article
Suggest improvement
Share your thoughts in the comments
Please Login to comment...