Categorical data is a set of predefined categories or groups an observation can fall into. Categorical data can be found everywhere. For instance, survey responses like marital status, profession, educational qualifications, etc. However, certain problems can arise with categorical data that must be dealt with before proceeding with any other task. This article discusses various methods to handle categorical data in a DataFrame. So, let us look at some problems posed by categorical data and how to handle categorical data in a DataFrame.
As mentioned earlier, categorical data can only take up a finite set of values. However, due to human error, while filling out a survey form, or any other reason, some bogus values could be found in the dataset.
Importing Libraries
Python libraries make it very easy for us to handle categorical data in a DataFrame and perform typical and complex tasks with a single line of code.
- Pandas – This library helps to load the data frame in a 2D array format and has multiple functions to perform analysis tasks in one go.
- Numpy – Numpy arrays are very fast and can perform large computations in a very short time.
- Matplotlib/Seaborn – This library is used to draw visualizations.
- Sklearn – This module contains multiple libraries having pre-implemented functions to perform tasks from data preprocessing to model development and evaluation.
Python3
import numpy as np
import pandas as pd
import matplotlib.pyplot as plt
import seaborn as sb
from sklearn.preprocessing import LabelEncoder
|
Now let’s load the dataset into the pandas dataframe.
Python3
main_data = pd.read_csv('demographics.csv')
main_data.head()
|
Output:

First five rows of the dataset
To understand membership constraints, consider the feature, and blood type. We need to verify whether the blood type feature consists of bogus values or not. First, we need to create a data frame with all possible values of blood type that are valid.
Python3
blood_type_categories = pd.DataFrame({
'blood_type': ['A+', 'A-', 'B+', 'B-', 'AB+', 'AB-', 'O+', 'O-']
})
blood_type_categories
|
Output:

Now, the bogus values can be found using the difference method.
Python3
unique_blood_types_main = set(main_data['blood_type'])
bogus_blood_types = unique_blood_types_main.difference(
blood_type_categories['blood_type']
)
bogus_blood_types
|
Output:
{'C+', 'D-'}
Once the bogus values are found, the corresponding rows can be dropped from the dataset. In some scenarios, the values could be replaced with other values if there is information available. However, since there is no information available regarding the true blood type, they will be dropped.
Python3
bogus_records_index = main_data['blood_type'].isin(bogus_blood_types)
without_bogus_records = main_data[~bogus_records_index]
without_bogus_records['blood_type'].unique()
|
Output:
array(['A+', 'B+', 'A-', 'AB-', 'AB+', 'B-', 'O-', 'O+'], dtype=object)
Inconsistent Categories Handling
Inconsistencies could arise in categorical data quite often. Consider the feature, marriage status. Let us take a look at all the unique values of marital status.
Python3
main_data['marriage_status'].unique()
|
Output:
array(['married', 'MARRIED', ' married', 'unmarried ', 'divorced',
       'unmarried', 'UNMARRIED', 'separated'], dtype=object)
It is quite evident that there are redundant categories due to leading and trailing spaces as well as capital letters. First, let us deal with capital letters.
Python3
inconsistent_data = main_data.copy()
inconsistent_data['marriage_status'] = inconsistent_data['marriage_status']\
.str.lower()
inconsistent_data['marriage_status'].unique()
|
Output:
array(['married', ' married', 'unmarried ', 'divorced', 'unmarried',
       'separated'], dtype=object)
Next, we will deal with leading and trailing spaces.
Python3
inconsistent_data['marriage_status'] = inconsistent_data['marriage_status']\
.str.strip()
inconsistent_data['marriage_status'].unique()
|
Output:
array(['married', 'unmarried', 'divorced', 'separated'], dtype=object)
Handle Remapping Categories
Numerical data like age or income can be mapped to different groups. This helps in getting more insights about the dataset. Let us explore the income feature.
Python3
print(f"Max income - {max(main_data['income'])},\
Min income - {min(main_data['income'])}")
|
Output:
Max income - 190000, Min income - 40000
Now, let us create the range and labels for the income feature. Pandas’ cut method is used to achieve this.
Python3
range = [40000, 75000, 100000, 125000, 150000, np.inf]
labels = ['40k-75k', '75k-100k', '100k-125k', '125k-150k', '150k+']
remapping_data = main_data.copy()
remapping_data['income_groups'] = pd.cut(remapping_data['income'],
bins=range,
labels=labels)
remapping_data.head()
|
Output:
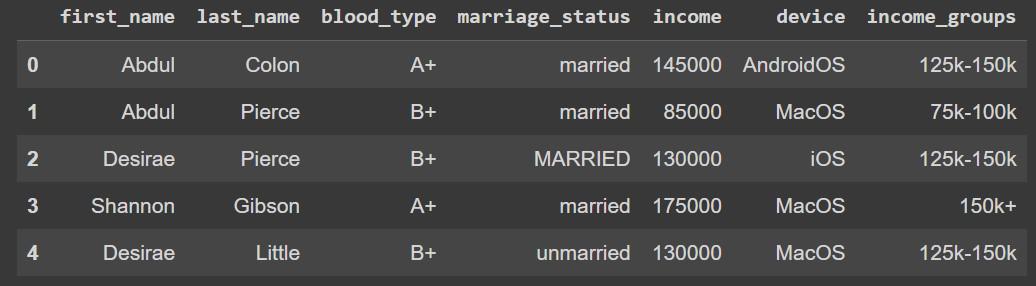
First five rows of the dataset.
Now, it is easier to visualize the distribution.
Python3
remapping_data['income_groups'].value_counts().plot.bar()
|
Output:

Barplot for the count of each income category
Cleaning Categorical Data in Python
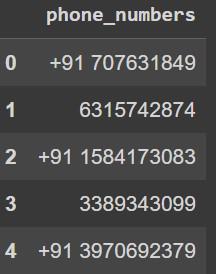
To understand this problem, a new data frame with just one feature, phone numbers are created.
Python3
phone_numbers = []
for i in range(100):
number = random.randint(100000000, 9999999999)
if(i % 2 == 0):
phone_numbers.append('+91 ' + str(number))
else:
phone_numbers.append(str(number))
phone_numbers_data = pd.DataFrame({
'phone_numbers': phone_numbers
})
phone_numbers_data.head()
|
Output:
Based on the use case, the code before numbers could be dropped or added for missing ones. Similarly, phone numbers with less than 10 numbers should be discarded.
Python3
phone_numbers_data['phone_numbers'] = phone_numbers_data['phone_numbers']\
.str.replace('\+91 ', '')
num_digits = phone_numbers_data['phone_numbers'].str.len()
invalid_numbers_index = phone_numbers_data[num_digits < 10].index
phone_numbers_data['phone_numbers'] = phone_numbers_data.drop(
invalid_numbers_index)
phone_numbers_data = phone_numbers_data.dropna()
phone_numbers_data.head()
|
Output:

Finally, we can verify whether the data is clean or not.
Python3
assert phone_numbers_data['phone_numbers'].str.contains('\+91 ').all() == False
assert (phone_numbers_data['phone_numbers'].str.len() != 10).all() == False
|
Visualizing Categorical Data in Python Pandas
Various plots could be used to visualize categorical data to get more insights about the data. So, let us visualize the number of people belonging to each blood type. We will make use of the seaborn library to achieve this.
Python3
sns.countplot(x='blood_type',
data=without_bogus_records)
|
Output:

Countplot for blood_type category
Furthermore, we can see the relationship between income and the marital status of a person using a boxplot.
Python3
sns.boxplot(x='marriage_status',
y='income',
data=inconsistent_data)
|
Output:

Boxplot for marriage_status with income
Encoding Categorical Data in Python
Certain learning algorithms like regression and neural networks require their input to be numbers. Hence, categorical data must be converted to numbers to use these algorithms. Let us take a look at some encoding methods.
Label Encoding in Python
With label encoding, we can number the categories from 0 to num_categories – 1. Let us apply label encoding on the blood type feature.
Python3
le = LabelEncoder()
without_bogus_records['blood_type'] = le.fit_transform(
without_bogus_records['blood_type'])
without_bogus_records['blood_type'].unique()
|
Output:
array([0, 4, 1, 3, 2, 5, 7, 6])
One-hot Encoding in Python
There are certain limitations of label encoding that are taken care of by one-hot encoding.
Python3
inconsistent_data = pd.get_dummies(inconsistent_data,
columns=['marriage_status'])
inconsistent_data.head()
|
Output:

Ordinal Encoding in Python
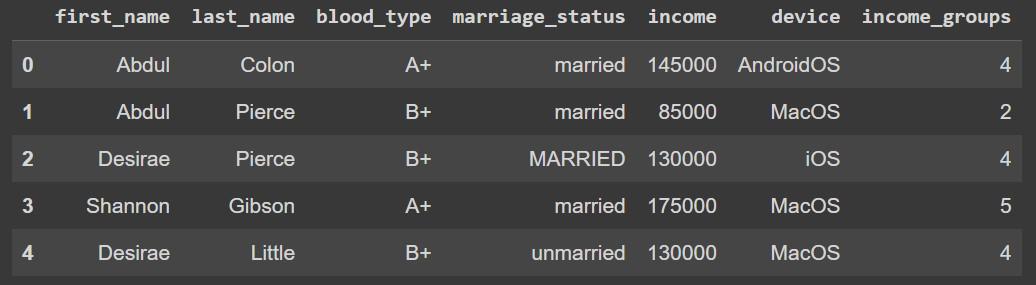
Categorical data can be ordinal, where the order is of importance. For such features, we want to preserve the order after encoding as well. We will perform ordinal encoding on income groups. We want to preserve the order as 40K-75K < 75K-100K < 100K-125K < 125K-150K < 150K+
Python3
custom_map = {'40k-75k': 1, '75k-100k': 2, '100k-125k': 3,
'125k-150k': 4, '150k+': 5}
remapping_data['income_groups'] = remapping_data['income_groups']\
.map(custom_map)
remapping_data.head()
|
Output:
Similarly, different encodings can be applied according to the use case.
Like Article
Suggest improvement
Share your thoughts in the comments
Please Login to comment...