Hand-Written Digits using Topological Data Analysis
Last Updated :
21 Mar, 2024
Given a hand-written digit picture, we need to convert it into graph plots using point clouds.
Examples: Given a handwritten digit. We have to convert it into graph
Input :
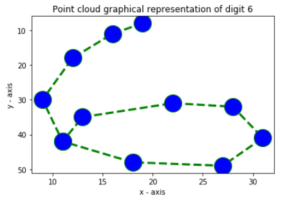
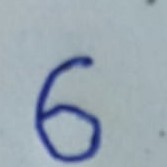 Output :
Input :
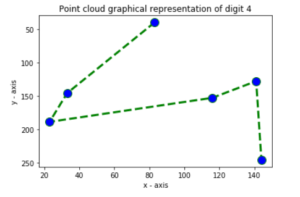
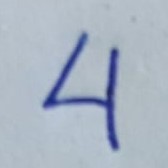 Output :
There are some steps to follow to convert the given image to plots.
- Binarise the image using thresholding techniques.
- Apply component labelling of the image.
- Using TDA Mapper, convert the image into point cloud and plot.
Step 1:
Binarisation: Binarisation means to convert the pixel image to binary image. More simply, it is to convert the image to an pixel array, that will just contain 0 and 1.
from PIL import Image
col = Image.open("im.pgm")
gray = col.convert('L')
bw = gray.point(lambda x: 0 if x<138 else 255, '1')
bw.save("binary.png")
display(Image.open("binary.png"))
|
We have converted our image to binary and it looks like this-
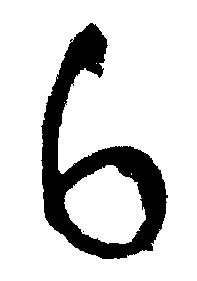
Figure: Binary image
Step 2:
Component Labelling: Using component labelling we can label the picture separately along with its components. For example, we can differentiate between the holes of digit 8 and background. Here is the code for component labelling along with example.
import cv2
import numpy as np
import random
class QuickUnionUF:
def __init__(self, N):
self.id = list(range(N))
self.sz = [0] * N
@classmethod
def fromimage(self, im):
self.id = im
self.sz = [0] * len(im)
def root(self, i):
while (i != self.id[i]):
i = self.id[i]
return i
def getresult(self):
result = [self.root(i) for i in self.id]
return result
def connected(self, p, q):
return self.root(p) == self.root(q)
def union(self, p, q):
i = self.root(p)
j = self.root(q)
if (i == j):
return
if (self.sz[i] < self.sz[j]):
self.id[i] = j
self.sz[j] += self.sz[i]
else:
self.id[j] = i
self.sz[j] += self.sz[i]
def bwlabel(im):
M, N = im.shape[:2]
qf = QuickUnionUF(M * N)
for i in range(M - 1):
for j in range(N - 1):
if (im[i][j] == im[i][j + 1]):
qf.union(i * N + j, i * N + j + 1)
if (im[i + 1][j] == im[i][j]):
qf.union(i * N + j, (i + 1) * N + j)
mask = np.reshape(np.array(qf.getresult()), (M, N))
values = np.unique(mask).tolist()
random.seed()
colors = [(random.randint(0, 255), random.randint(0, 255),
random.randint(0, 255)) for k in range(len(values))]
out = np.zeros((M, N, 3))
for i in range(M):
for j in range(N):
label = values.index(mask[i][j])
out[i, j] = colors[label]
return out
im = cv2.imread("binary.png", cv2.IMREAD_GRAYSCALE)
out = bwlabel(im > 100)
cv2.imwrite("result1.png", out)
|
Here is the output image:

Figure: Component Labelled Image
As you can see, the background, the hole of 6 is differentiated by different colour.
Step 3:
Using TDA Mapper: The Mapper algorithm is a method for topological data analysis. It has large applications, a small part being, plotting maps. This package comes with Scikit-TDA of python. For installation of TDA-Mapper in PC, refer this-http://danifold.net/mapper/installation/index.html.
After installation, if we run MapperGUI.py, we will get a python application and we can input the component labelled image. After this, we will get the output image as-
Figure: Graph.
Like Article
Suggest improvement
Share your thoughts in the comments
Please Login to comment...