Groupby without aggregation in Pandas
Last Updated :
29 Aug, 2021
Pandas is a great python package for manipulating data and some of the tools which we learn as a beginner are an aggregation and group by functions of pandas.
Groupby() is a function used to split the data in dataframe into groups based on a given condition. Aggregation on other hand operates on series, data and returns a numerical summary of the data. There are a lot of aggregation functions as count(),max(),min(),mean(),std(),describe(). We can combine both functions to find multiple aggregations on a particular column. For further details about this refer to this article How to combine Groupby and Multiple aggregation function in Pandas.
Instead of using groupby aggregation together, we can perform groupby without aggregation which is applicable to aggregate data separately. We will see this with an example where we will take a breast cancer dataset with different numerical features like mean area, worst texture, and many more. The target column has 0 which means the cancer is benign and 1 means the cancer is malignant.
Example 1:
Python3
import numpy as np
import pandas as pd
from sklearn import datasets
from sklearn.datasets import load_breast_cancer
cancer_data = load_breast_cancer()
df = pd.DataFrame(cancer_data.data, columns=cancer_data.feature_names)
df['target'] = pd.Series(cancer_data.target)
df.head()
|
Output:
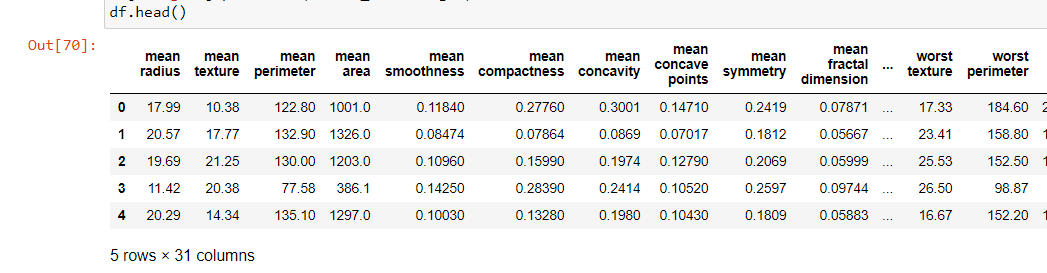
Thus, we can visualize the data which have all the columns, but all the columns are in numerical form and there are no categorical data instead of only the target column, so let’s have a look in target and another column named ‘worst texture’.
Python3
print(df['target'].describe(), df['worst texture'].describe())
|
Output:
count    569.000000
mean       0.627417
std        0.483918
min        0.000000
25%        0.000000
50%        1.000000
75%        1.000000
max        1.000000
Name: target, dtype: float64
count    569.000000
mean      25.677223
std        6.146258
min       12.020000
25%       21.080000
50%       25.410000
75%       29.720000
max       49.540000
Name: worst texture, dtype: float64
Here we can see the summary of target and worst texture column, we take only these columns to understand the groupby aggregate functions better.
Python3
df1 = df[['worst texture', 'worst area', 'target']]
gr1 = df1.groupby(df1['target']).mean()
gr1
|
Output:
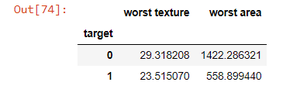
So here we see the mean of worst texture and worst area grouped around benign and malignant cancer, now the normal data has been interfered by this method, and we have to add them separately there’s why groupby without aggregation becomes handy.
Python3
def meanofTargets(group1):
wt = group1['worst texture'].agg('mean')
wa = group1['worst area'].agg('mean')
group1['Mean worst texture'] = wt
group1['Mean worst area'] = wa
return group1
df2 = df1.groupby('target').apply(meanofTargets)
df2
|
Output:
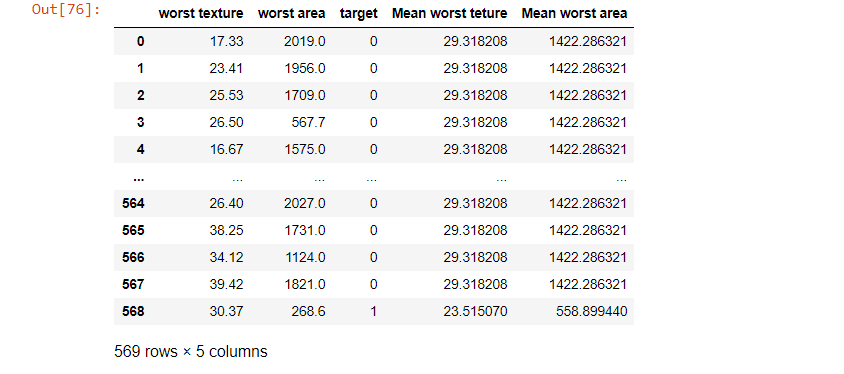
Thus, in the above dataset, we are able to join the mean of the worst area and worst texture in a separate column, and we do it with groupby method of the target column where it grouped ‘1’s and 0’s separately.
Example 2:
Similarly, let’s see another example of using groupby without aggregation. But as there is no categorical column we will have to make a categorical column myself. For this, let’s choose mean area which have a max value of 2500 and min value of 150, so we will classify them into 6 groups of range 400 using the pandas cut method to convert continuous to categorical. As this doesn’t concern subject of the article refer to the GitHub repo here for more info.
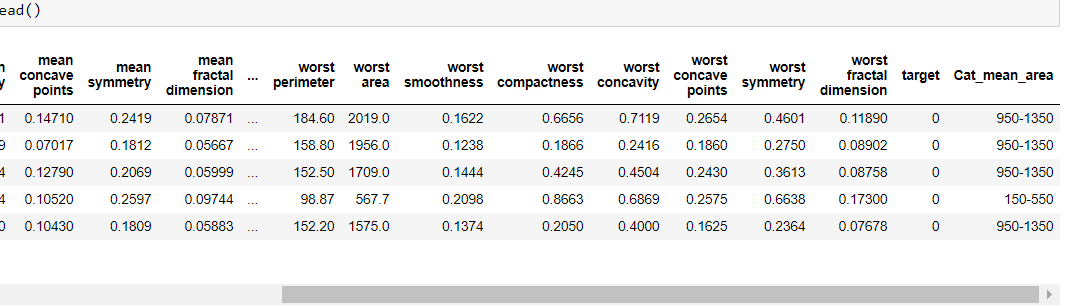
Thus, we make a categorical column ‘Cat_mean_area’ and we can perform the groupby aggregation method here too. But instead of grouping the whole dataset we can use some specific columns like mean area and target only.
Python3
df_3 = df_2[['mean area', 'Cat_mean_area', 'target']]
gr2 = df_3.groupby(df_2['Cat_mean_area']).sum()
gr2
|
Output:
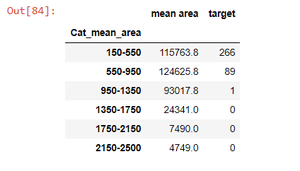
Thus, by the steps mentioned above, we perform groupby without aggregation.
Python3
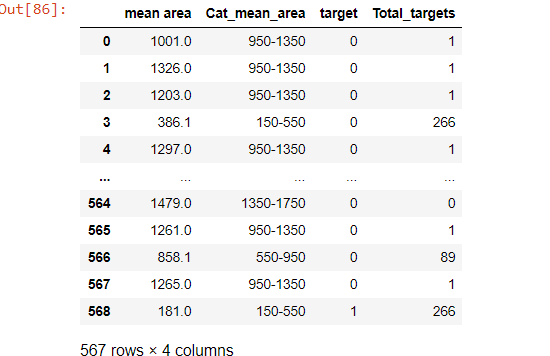
def totalTargets(group):
g = group['target'].agg('sum')
group['Total_targets'] = g
return group
df_4 = df_3.groupby(df_3['Cat_mean_area']).apply(totalTargets)
df_4
|
Output:
Like Article
Suggest improvement
Share your thoughts in the comments
Please Login to comment...