Data can be described numerically by various statistics, or statistical measures. These statistical measures are often grouped in 3 categories:
1. Measures of central tendency
2. Measures of position
3. Measures of dispersion
Measures Of Central Tendency:
In statistics, a central tendency (or measure of central tendency) is a central or typical value for a probability distribution. It may also be called a center or location of the distribution.
Measures of central tendency indicate the “center” of the data along the number line and are usually reported as values that represent the data. There are three common measures of central tendency:
- Arithmetic mean, usually called the average or simply the mean
- Median
- Mode
1. Arithmetic Mean:
It is the well known measure of central tendency. Mean is average of a given set of data.To calculate the mean of n numbers, take the sum of the n numbers and divide it by n.
Mean for Ungrouped data can be defined as,

Mean for Grouped data:

Where,
f is frequency in each class,
x is midpoint in each class,
n is total number of scores
Example:
There are 16 numbers in a list find there mean (average)
2, 4, 4, 5, 7, 7, 7, 7, 7, 7, 8, 8, 9, 9, 9, 9
Explanation:
There are 6 different values hence can be considered as weighted mean because several values are repeated in a list. Hence 2 occur 1 times, 4 occur 2 times, 5 occur 1 time, 7 occur 6 times, 8 occur 2 times, 9 occur 4 times
Mean

2. Median:
The mean can be affected by just a few values that lie far above or below the rest of the data, because these values contribute directly to the sum of the data and therefore to the mean. By contrast, the median is a measure of central tendency that is fairly unaffected by unusually high or low values relative to the rest of the data.
Median is the middle value of a set of data. To calculate the median of n numbers, first order the numbers from least to greatest.
- If n is odd then median is the middle number
- If n is even then median is the average of two middle values
Median for grouped data:
Median = 
Where,
L is the lower class boundary of the group containing the median,
n is the total number of data,
B is the cumulative frequency of the groups before the median group,
G is the frequency of the median group,
w is the group width
Example:
Consider 6 numbers find there mean and median replace 8 with 38 then again find mean and median
4, 4, 5, 7, 8, 8
Explanation:
Here n is even, so
Median = avg (value at (n/2) + value at (n/2)+1)
Median =


And,

Mean =
And,
Mean = 
Now replacing 8 by 38, median will remain the same i.e., 6, but mean get affected.
Mean = 
3. Mode:
Mode is the value which occurs most frequently in a set of observations. The mode of the 6 numbers in the list 1, 3, 6, 4, 3, 5 is 3 because frequency of 3 is greater than all other elements.
Example:
Find mode of each part
(a) 1, 2, 4, 7
(b) 1, 1, 2, 2, 3, 4
Explanation:
(a) There is no mode (mode = none)
(b) There are 2 modes in this case 1, 2 (mode = 1, 2)
Measures Of Position:
There are three most basic positions or locations in a list of numerical data ordered from least to greatest
- The beginning, or the least value L
- The end, or the greatest value G
- The middle, or median M
Apart from these most common measures of positions are
(a). Quartiles:
A quartile is a statistical term describing a division of observations into four defined intervals. Quartiles divide the data into four equal groups after the data have been ordered from the least value L to the greatest value G. There are three quartile numbers, called the first quartile, the second quartile, and the third quartile, that divide the data into four roughly equal groups.
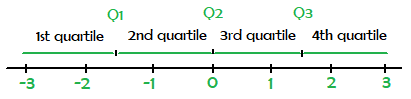
The numbers  and
and  divide the data into 4 roughly equal groups as follows. After the data are listed in increasing order, the first group consists of the data from L to
  , the second group is from to
  , the third group is from to , and the fourth group is from to G.
There are various rules to determine the exact values of  and . Basically is median. For and arrange the data into increasing order:
- is the median of the first half of the data in the ordered list,
- is the median of the second half of the data in the ordered list,
Example:
Find the quartiles for the list of 16 numbers,
2, 4, 4, 5, 7, 7, 7, 7, 7, 7, 8, 8, 9, 9, 9, 9
Explanation:
Median( ) =
) =  = 7
= 7
For and divide the data into two smaller group. First group contain 2, 4, 4, 5, 7, 7, 7, 7 and second group contain 7, 7, 8, 8, 9, 9, 9, 9 now,
 = 6 (average of 6 and 7)
 = 8.5 (average of 8 and 9)
In this example, we can say that 4 is in first quartile (or first group), 8 is in third quartile (third group) and 9 is in fourth quartile. The phrase “in a quartile” refers to being in one of the four groups determined by , and .
(b). Percentiles:
Percentiles are mostly used for very large lists of numerical data ordered from least to greatest.Instead of four groups it divide the data into 100 equal groups. The 99 percentiles  divide the data into 100 equal groups. Here,
 =
 =

 =

 =
 =
=
Percentile in competitive examination is calculated as,
Percentile = (number of people behind you / total number of people) x 100
Measures Of Dispersion:
Measures of dispersion indicate the degree of spread of the data. The most common statistics used as measures of dispersion are,
- The range
- The interquartile range
- The standard deviation
1. Range:
Range reflects the maximum spread of the data. The range of the numbers in a group of data is the difference between the greatest number G in the data and the least number L in the data; that is,
Range(R) = G-L
Sometimes a data value is unusually small or unusually large in comparison with the rest of the data. Such data are called Outliers. An outlier is a data point that differs significantly from other observations . Outliers lie so far out from the rest of the data. Range is affected by outliers
Example:
Five numbers are given find range,
11, 10, 5, 13, 21
Explanation:
Greatest number (G) = 21
Least number (L) = 5
Range (R) = 21-5 = 16
2. Interquartile Range:
Interquartile range is defined as the difference between the third quartile and the first quartile. That is,  . It measures the spread of the middle half of the data and not affected by outliers.
3. Standard Deviation:
Standard deviation is a measure of spread. It is a measure of how spread out numbers are. symbol is  . The more the data are spread away from the mean, the greater the standard deviation; and the more the data are clustered around the mean, the lesser the standard deviation.
The standard deviation of a group of numerical data can be computed as,
- Calculate the mean of the values,
- Find the difference between the mean and each of the values,
- Square each of the differences,
- Find the average of the squared differences,
- Take the non negative square root of the average of the squared differences,
Refer for Mean, Variance and Standard Deviation
Share your thoughts in the comments
Please Login to comment...