GRE Data Analysis | Data Interpretation Examples
Last Updated :
09 Jul, 2019
Data Interpretation simply means to understand given data and transforming the same data into the desired property. Data given can be in any form from below given data representations
- Table
- Circular Graph
- Venn Diagram
- Bar Graph
- Scattered Plots
- Line Graphs
Approximately three Data Interpretation questions per section are asked in GRE and it can be of any type either MCQ or Numeric Entry.
Data represented in Table Form:
The table shows a comparison of two plans(call charges for 1 minute and call charges for 2 minutes) provided by telecom companies. Please answer questions as per the table.
| Telecom Companies |
Call Charge per minute |
Call Charge per 2 minutes |
| B |
0.94 |
1 |
| A |
0.98 |
1 |
| R |
0.98 |
0.98 |
| V |
0.95 |
0.98 |
| M |
2 |
2.2 |
| U |
1.1 |
1.3 |
| T |
1.8 |
2.0 |
Ques-1:
Which company provides highest percentage increase in call charges from one minute plan to two minutes plan ?
Explanation:
For B, the Percentage increase = 0.06/0.94 = 6/94

6% (slightly greater than 6%)
For A, the Percentage increase = 0.02/0.98 = 2/98
2% (Slightly greater than 2%)
For R, there is no increase in the rates.
For V, the Percentage Increase = 0.03/0.95 = 3/95
3% (Slightly greater than 3%)
For M, the Percentage Increase = 0.2/2 = 1/10 = 10%
For U, the Percentage Increase = 0.2/1.1 = 2/11
20% (Slightly less than 20%)
For T, the Percentage Increase = 0.2/1.8 = 2/18 = 11%
So the answer is U with 20% increase.
Ques-2:
How many companies increased charges in second plan greater than 10% ?
Explanation:
For B, the Percentage increase = 0.06/0.94 = 6/94
6% (slightly greater than 6%)
For A, the Percentage increase = 0.02/0.98 = 2/98
2% (Slightly greater than 2%)
For R, there is no increase in the rates.
For V, the Percentage Increase = 0.03/0.95 = 3/95
3% (Slightly greater than 3%)
For M, the Percentage Increase = 0.2/2 = 1/10 = 10%
For U, the Percentage Increase = 0.2/1.1 = 2/11
20% (Slightly less than 20%)
For T, the Percentage Increase = 0.2/1.8 = 2/18 = 11%
So, the answer is 2.
Ques-3:
Based on the information in the table, which of the following three statements are true?
Explanation:
Statement 1: Percentage increase in charges of the second plan of M and T are the same.
Statement 2: M provides costly services amongst them all.
Statement 3: All companies provide less than 20% difference in both the plans.
- Statement-1: FALSE
Bases are different in both cases. Quantity with the higher base provides more percentage increase. In our case, it is M. Thus the statement is False.
- Statement-2: TRUE
Percentage increase, as well as the base of M, are highest. Thus it provides costly service amongst them all.
- Statement-3: TRUE
Increase in M rates are highest and also the percentage increase is highest which is slightly less than 20. Thus the statement is True.
Data represented in Circular Graph and Line Graph:
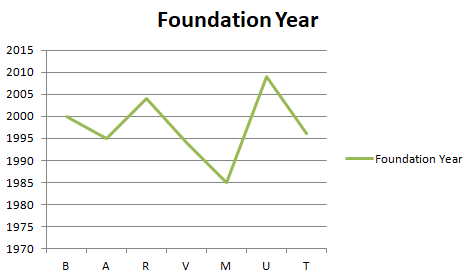
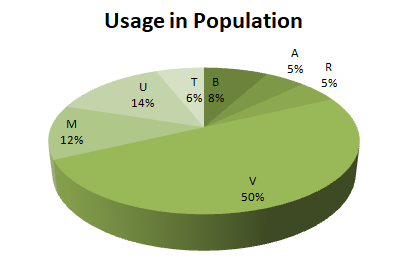
Above is mentioned the graph of Foundation years of different Telecom companies in a particular area and their usage in particular section. The total population of the section is 5, 00, 000.
Ques-1:
How many people use oldest telecom services?
Explanation:
The oldest telecom company is M having been founded in 1985.
From the pie chart, we can say that 12% of the population use telecom services provided by M.
Thus the answer is = 5, 00, 000 * (12/100) = 60, 000
Ques-2:
The companies founded after 2000 cover how much percentage of population ?
Explanation:
There are only two companies founded after 2000, which are R and U. So, the percentage of the population covered by these companies are (14 + 5) = 19%
Data represented in Venn Diagram:
In a survey of 20, 000 people, 5, 300 have used telecom services provided by A; 10, 555 used telecom services provided by B and 2, 000 people have used services provided by both the providers.
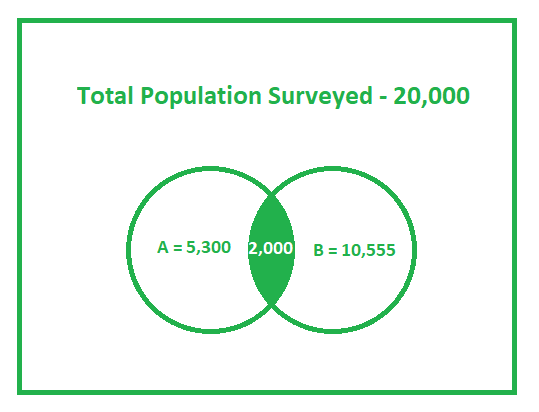 Ques-1:
How many people are using telecom services provided by A but not B ?
Explanation:
People using services provided by A – People using services provided by both
= 5300 – 2000
= 3300
Ques-2:
How many people are using services provided by at least one service provider ?
Explanation:
People using services provided by A + People using services provided by B – People using services provided by both
= 5300 + 10555 – 2000
= 13855
Ques-3:
How many people do not use services provided by either of the service providers ?
Explanation:
Total – People using at least one service,
= 20000 – 13855
= 6145
Like Article
Suggest improvement
Share your thoughts in the comments
Please Login to comment...