Graphical Models in R Programming
Last Updated :
03 Dec, 2021
In this article, we are going to learn about graphical models in detail in the R programming language. In this, we are going to discuss the graphical model or probabilistic graphical models are statistical models that encode multivariate probabilistic distributions in the form of a graph, its real-life applications, and types, and decomposition with undirected and directed graphs, and separation in graphs.
Graphical Models in R Programming
It refers to a graph that represents relationships between a set of variables. By a set of vertices and edges, we design these models to connect those nodes. Declaring a graph by the following equation:
G = (V, E)
Where:
V: a finite set of nodes or vertices
E: a finite set of edges or links or arcs
Types of Graphical Models in R Programming
Two main types of graphical models in R are as follows:
- Directed Graph
- Undirected Graph
Directed/Bayesian Graphical Models
In this, Directed Networks are based or depend upon the directed graphs. Therefore, they are known as Directed R graphical models. Directed graph or digraph is represented by
D = (V, A)
Where,
- V: V set whose elements are called nodes or vertices
- A: It is a set of ordered pair of vertices called arcs or arrows or directed edges
Terminologies of Directed graph:
These are the few terms belong to the directed graph
- Parent and child note
- D- connected nodes
- Connected nodes
- Polytree
- Tree
Decomposition and Directed Graphs
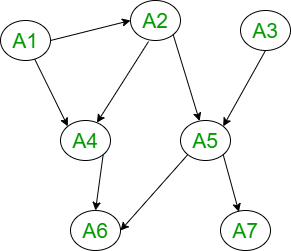
A directed graph is a probability distribution of attributes over a set U and it can also be called as factorizable wrt to a directed acyclic graph and its representation is given as G = (U, E) and it can be written as a product of conditional probabilities of the attributes given their parent in G. The below figure represents a factorization or decomposition into four terms for a directed graph.
Undirected Graphical Models
In this case of Markov Networks, they basically depend upon an undirected graph. Therefore, they are known as undirected graphical models, and they are also known as Markov Random Fields. A graph in which edges do not possess any form of orientation or shape is known as an undirected graph. A graph is indirect if it follows this condition
∀A, B ∈ V: (A, B) ∈ E ⇒ (B, A) ∈ E.
Terminologies of Undirected graph:
These are the few terms belong to the undirected graph
- Adjacent node
- Set of neighbors
- Degree of node
- Closure of node
- Tree
- Subgraph
- Complete Graph
- Clique
Conditional Independence in Graphs
In this case, To describe a domain in the study each node or vertex represents an attribute and each edge represents a direct dependence between the two attributes. For drawing a relationship that contains conditional independence between the different variables from their standard parametric forms a graphical model is used. In the principle, every part depends on each other, and knowing where the feet can be and where the head is put the constraints on. If you want to know the torso position can affect the left foot’s position and you know the position of the left leg. Conditional independence in the graph state that it is not going to affect.
Decomposition or Factorization in Graphs
To find a decomposition of a distribution Conditional Independence in graphs is the only possible way to do it. Figuring out a minimal conditional independence graph is the same as figuring out the best decomposition. We are now going to study the following:
- Decomposition or factorization wrt directed graphs.
- Decomposition or factorization wrt undirected graphs.
Decomposition and Undirected Graphs
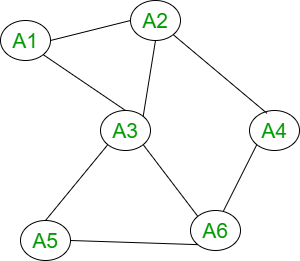
An undirected graph is a probability distribution of attributes over a set U and it can also be called factorizable wrt an undirected graph G = (U, E) and it can be written as the product of maximum cliques and nonnegative functions of G. M is a family of attributes, such that subgraphs from the sets M of G belongs to the maximum cliques of it. From the figure given below, we can say that it represents factorization into four terms for an undirected graph. 4 terms represent the 4 maximum cliques by the four sets
{A1, A2, A3}, {A3, A5, A6}, {A2, A4} and {A4, A6}
Conditional Independence and Separation in Graphs
Associative conditional independence with separation in graphs. Separation in graphs is basically depended upon the graph whether it is directed or undirected.
- Directed Graph:
- G = (V, E) X, Y, and Z are three disjoint subsets of nodes.
- If there is an unblocked path between X and Y, they are d-connected.
- Undirected Graph:
- G = (V, E) where, X, Y, and Z are three disjoint subsets of nodes.
- If all paths from a node in X to a node in Y contain a node in Z, then it separates X and Y in G, written as <X | Z | Y>G.
Like Article
Suggest improvement
Share your thoughts in the comments
Please Login to comment...