Google Cloud Platform – Data Visualization in BigQuery
Last Updated :
30 Mar, 2023
Whether you’re exploring a data set for the first time or summarizing the findings of your analysis to an audience, you can use data visualization to make large, complex data sets easier to understand and internalize.
In this article, we will look into visualizing your BigQuery data. Data visualization is a tool that helps you turn your complex data into compelling stories, unlocking the insights that both you and your audience need to steer decision-making. For example, using dashboards or infographics can help spark and guide discussion while the group explores the data together. However, data visualization is not just for communicating with decision-makers. It is also an important part of the exploratory analysis phase. Seeing data in the visual form helps you, as an analyst, identify patterns, outliers, trends, or other interesting data points you want to investigate further.
Choosing a data visualization tool comes down to understanding your needs.
- First, consider your use case. Are you performing basic data visualization and reporting? Or more advanced tasks, such as data modeling?
- Secondly, you’ll want to balance the cost of the tool against its feature set and its learning curve.
Fortunately, BigQuery is connected with several visualization tools, including those across the partner ecosystem. So there’s sure to be one that’s right for you.
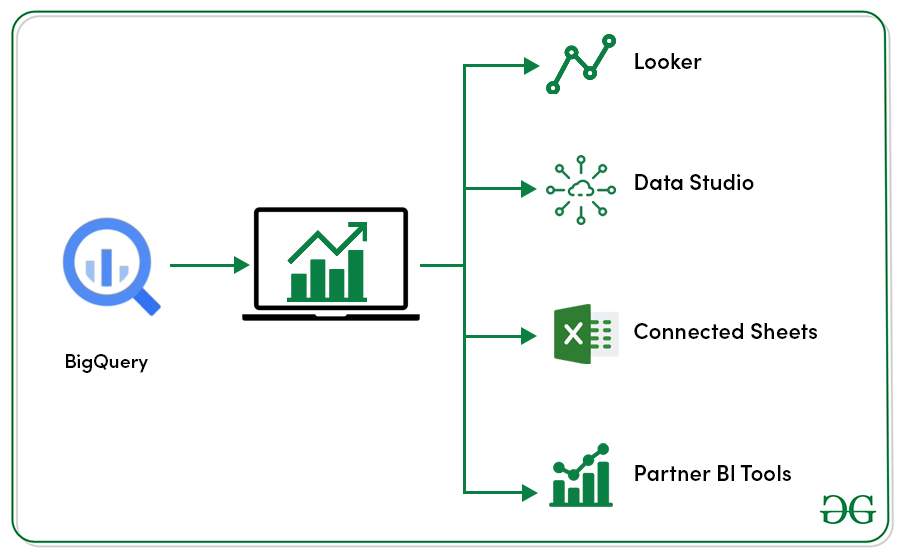
In this article, we’ll introduce two of these tools:
- Data Studio
- Connected Sheets
Both give you the ability to create quick, ad hoc data visualizations, as well as dashboards and reports. Let’s take a closer look at each one.
Data Studio:
Data studio is Google’s business intelligence and data visualization platform that lets you build scalable, serverless interactive dashboards. Data Studio has two main components.
The first, Explorer, is a place for you to quickly derive insights from your data during the exploratory phase of data analysis. It can be accessed directly from BigQuery. Just click Explorer in Data Studio from your query results page.
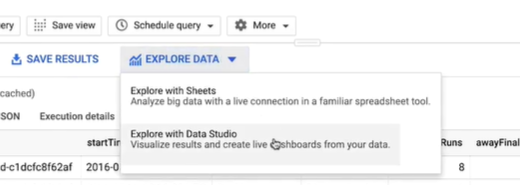
Data Studio will automatically launch and create a direct connection to the query results. You’ll land in the Explorer interface, where you can create quick visualizations through drag and drop functionality. On the back end, Data Studio is creating SQL queries in BigQuery to support your exploration in real-time. In fact, you can also use Explorer with a BigQuery table itself, rather than query results, which means you don’t need to write any SQL at all. Just select the table and click Export, and choose Explorer in Data Studio. The visuals you create in Explorer can be exported into the Reports component of Data Studio. Data Studio Reports provides a canvas for bringing together visuals into a dashboard, report, or infographic. They’re easy to share, embed, and publish. Plus, you can make them interactive for your viewer by adding an option to filter, or select a date range directly in the live report. Data Studio is a great pick if you want power with flexibility and don’t mind taking a little bit of time to get to know a new tool. Plus, it’s available for free.
Connected Sheets:
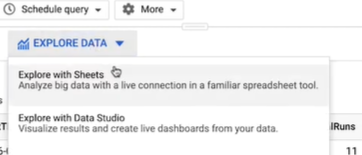
If you’re looking to wipe away the learning curve pretty much completely for you and your collaborators, you can do so with a second tool, Connected Sheets. Connected Sheets allows you to analyze and visualize your BigQuery data, up to billions of rows, directly in a Google Sheet. So if you’re a user of Spreadsheets, you already know all you need to know. You can access Connected Sheets right from your BigQuery table or your query results by clicking Explore with Sheets.
This will open up a new Google Sheet with a tab that has a direct connection to the full big query table.
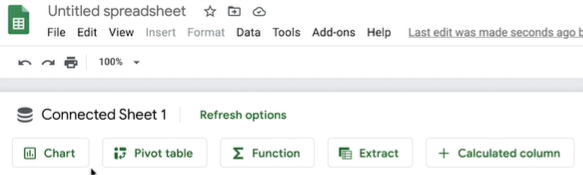
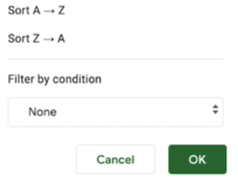
Your Connected Sheet shows a preview of the table, which can be explored by sorting and filtering.
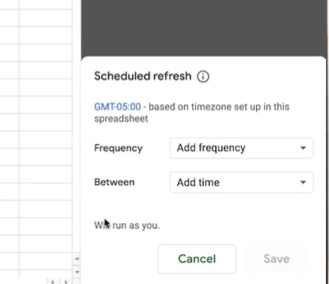
You can also reference the connected Sheets in charts, pivot tables, and functions, which then use the entire BigQuery table in its calculations. In order to support these functions, Connected Sheets runs queries in BigQuery on your behalf. You can manually request the query to run by hitting Apply. Results of those queries are saved in your spreadsheet for analysis and sharing. You can also schedule data to refresh automatically.
A quick note on availability. Connected Sheets is a feature available only for G Suite Enterprise, Enterprise for Education, and Drive Enterprise account customers.
There’s a lot to learn in the field of data visualization. As you gain experience, you can learn to create more effective visuals, use them to tell compelling stories, and fine-tune your design skills.
Like Article
Suggest improvement
Share your thoughts in the comments
Please Login to comment...