ggtheme Package in R
Last Updated :
20 Dec, 2023
R is a programming language used for performing statistical computation and graphical purposes. It is currently supported and backed by the R Core Team and the R Foundation for Statistical Computing. For data analysis and the creation of statistical software, R is used by statisticians, bioinformaticians, and data miners.
The programming language R is one of the most popular ones for data mining. In this article, we are going to talk about the ggthemes package in R Programming Language.
The ggthemes package provides the user the ability to modify plots. It provides additional themes, scales, and geoms for the ggplots package. Let us start by installing the ggthemes package. To do so use the following command:
install.packages('ggthemes')
In all the examples below we will be using the mtcars dataset.
Important functions in ggtheme in R
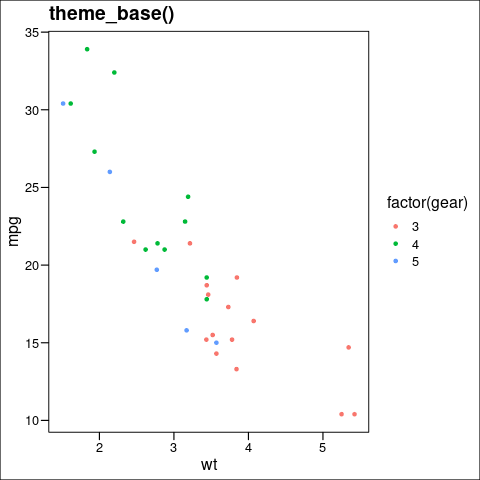
Theme_base() in ggtheme in R
It is a theme similar to the base R graphics theme.
Syntax: theme_base(base_size = 16, base_family = “”)
Parameters:
- base_size: The font size.
- base_family: The font family.
R
ggplot(mtcars) + geom_point(aes(x = wt, y = mpg,
colour = factor(gear))) + theme_base() + ggtitle("theme_base()")
|
Output:
ggtheme in R
theme_calc() in ggtheme in R
It is a theme similar to the default settings of LibreOffice Calc charts.
Syntax: theme_calc(base_size = 10, base_family = “sans”)
Parameters:
- base_size: The font size.
- base_family: The font family.
R
library(ggplot2)
library(ggthemes)
ggplot(mtcars, aes(x = wt, y = mpg, colour = factor(gear))) +
geom_point() +
theme_calc() +
ggtitle("theme_calc()")
|
Output:

ggtheme in R
theme_economist() in ggtheme in R
It is a theme that tries to approximate the theme of The Economist.
Syntax: theme_economist(base_size = 10, base_family = “sans”, horizontal = TRUE, dkpanel = FALSE)
Parameters:
- base_size: The font size.
- base_family: The font family.
- horizontal: It is a boolean that specifies whether horizontal lines should be there or not.
- dkpanel: It is logical and specifies whether a dark panel is needed or not.
R
library(ggplot2)
library(ggthemes)
ggplot(mtcars, aes(x = wt, y = mpg, colour = factor(gear))) +
geom_point() +
theme_economist() +
ggtitle("theme_economist()")
|
Output:

ggtheme in R
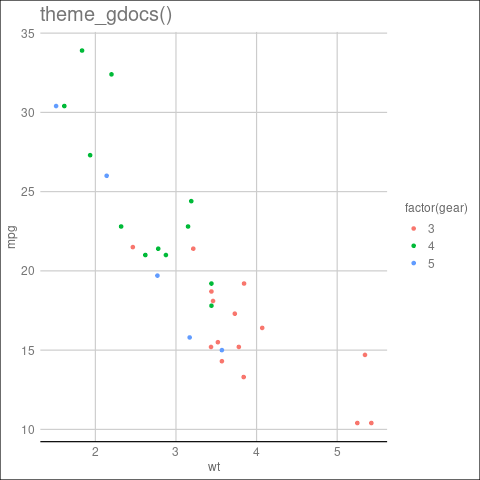
theme_gdocs() in ggtheme in R
It is a theme similar to the default look of Google Docs.
Syntax: theme_gdocs(base_size = 12, base_family = “sans”)
Parameters:
- base_size: The font size.
- base_family: The font family.
R
library(ggplot2)
library(ggthemes)
p <- ggplot(mtcars, aes(x = wt, y = mpg, colour = factor(gear))) +
geom_point() +
theme_gdocs() +
ggtitle("theme_gdocs()")
print(p)
|
Output:
ggtheme in R
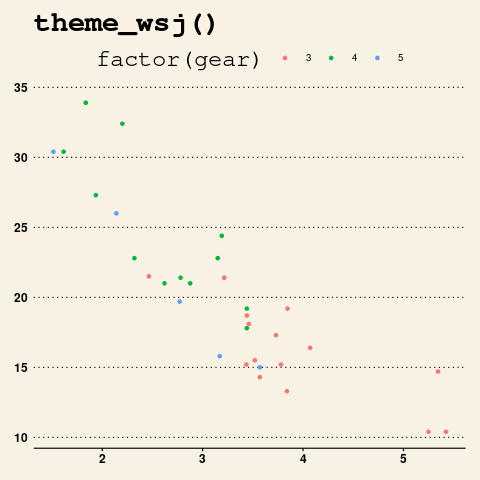
theme_wsj() in ggtheme in R
It is a theme that tries to approximate the theme of The Wall Street Journal.
Syntax: theme_wsj(base_size = 12, color = “brown”, base_family = “sans”, title_family = “mono”)
Parameters:
- base_size: The font size.
- color: The background color for the plot.
- base_family: The font family.
- title_family: The font family for the title.
R
library(ggplot2)
library(ggthemes)
p <- ggplot(mtcars, aes(x = wt, y = mpg, colour = factor(gear))) +
geom_point() +
theme_wsj() +
ggtitle("theme_wsj()")
print(p)
|
Output:
ggtheme in R
scale_colour_calc() in ggtheme in R
It is the color scale from LibreOffice.
Syntax: scale_colour_calc(…)
Parameters: It takes an options object with the following options:
- palette: This is the palette function.
- breaks: The breaks to be used for the color scale.
- limits: It is a parameter to be used to specify the possible values of the scale and their order.
- drop: It is a boolean that specifies whether the unused factor levels be omitted or not.
- na.translate: It is a parameter that the user can use to remove missing values from the discrete scale.
- scale_name: It is the name of the scale that should be used in error messages.
- name: It is the name of the scale.
- labels: The labels to use for the scale.
- expand: It is a parameter used to specify the expansion constants.
- guide: The parameter is used to create a guide for the scale.
- position: It is the position of the axis.
- super: It is the parent or super class to use for the constructed scale.
R
library(ggplot2)
library(ggthemes)
ggplot(mtcars) + geom_point(aes(x = wt,
y = mpg,
colour = factor(gear)))+ scale_colour_calc() +
ggtitle("scale_colour_calc()")
|
Output:

ggtheme in R
scale_colour_economist() in ggtheme in R
It is the color scale using the colors in The Economist.
Syntax: scale_colour_economist(…)
Parameters: It takes an options object with the following options:
- palette: This is the palette function.
- breaks: The breaks to be used for the color scale.
- limits: It is a parameter to be used to specify the possible values of the scale and their order.
- drop: It is a boolean that specifies whether the unused factor levels be omitted or not.
- na.translate: It is a parameter that the user can use to remove missing values from the discrete scale.
- scale_name: It is the name of the scale that should be used in error messages.
- name: It is the name of the scale.
- labels: The labels to use for the scale.
- expand: It is a parameter used to specify the expansion constants.
- guide: The parameter is used to create a guide for the scale.
- position: It is the position of the axis.
- super: It is the parent or super class to use for the constructed scale.
R
library(ggplot2)
library(ggthemes)
ggplot(mtcars) + geom_point(aes(x = wt,
y = mpg,
colour = factor(gear)))+ scale_colour_economist() +
ggtitle("scale_colour_economist()")
|
Output:

ggtheme in R
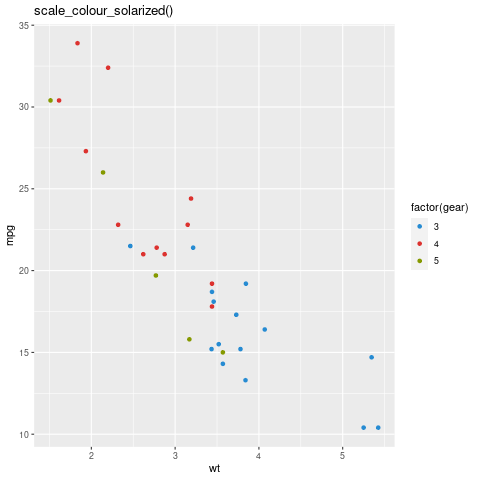
scale_colour_solarized() in ggtheme in R
It is the solarized color scale.
Syntax: scale_colour_solarized(accent,…)
Parameters:
- accent: The starting color:
- option: It is the following options:
- palette: This is the palette function.
- breaks: The breaks to be used for the color scale.
- limits: It is a parameter to be used to specify the possible values of the scale and their order.
- drop: It is a boolean that specifies whether the unused factor levels be omitted or not.
- na.translate: It is a parameter that the user can use to remove missing values from the discrete scale.
- scale_name: It is the name of the scale that should be used in error messages.
- name: It is the name of the scale.
- labels: The labels to use for the scale.
- expand: It is a parameter used to specify the expansion constants.
- guide: The parameter is used to create a guide for the scale.
- position: It is the position of the axis.
- super: It is the parent or super class to use for the constructed scale.
R
library(ggplot2)
library(ggthemes)
ggplot(mtcars, aes(x = wt, y = mpg, colour = factor(gear))) +
geom_point() +
scale_colour_solarized() +
ggtitle("scale_colour_solarized()")
|
Output:
ggtheme in R
Like Article
Suggest improvement
Share your thoughts in the comments
Please Login to comment...