Getting Started with Plotly-Python
Last Updated :
15 Jul, 2021
The Plotly Python library is an interactive open-source library. This can be a very helpful tool for data visualization and understanding the data simply and easily. plotly graph objects are a high-level interface to plotly which are easy to use. It can plot various types of graphs and charts like scatter plots, line charts, bar charts, box plots, histograms, pie charts, etc.
So you all must be wondering why plotly over other visualization tools or libraries? Here’s the answer –
- Plotly has hover tool capabilities that allow us to detect any outliers or anomalies in a large number of data points.
- It is visually attractive that can be accepted by a wide range of audiences.
- It allows us for the endless customization of our graphs that makes our plot more meaningful and understandable for others.
Ok, enough theory let’s start.
Installation:
To install this module type the below command in the terminal.
pip install plotly
Getting Started
Let’s create various plots using this module
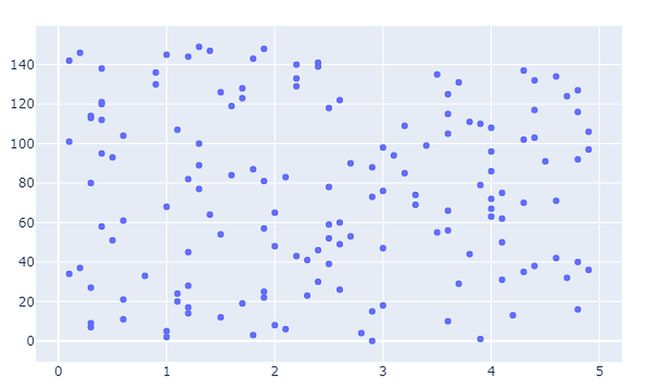
- Scatter Plot: Scatter plot represent values for two different numeric variables. They are mainly used for the representation of the relationship between two variables.
Python3
import numpy as np
import plotly
import plotly.graph_objects as go
import plotly.offline as pyo
from plotly.offline import init_notebook_mode
init_notebook_mode(connected=True)
x = np.random.randint(low=1, high=50, size=150)*0.1
y = np.random.randint(low=1, high=50, size=150)*0.1
fig = go.Figure(data=go.Scatter(x=x, y=y, mode='markers'))
fig.show()
|
Output:
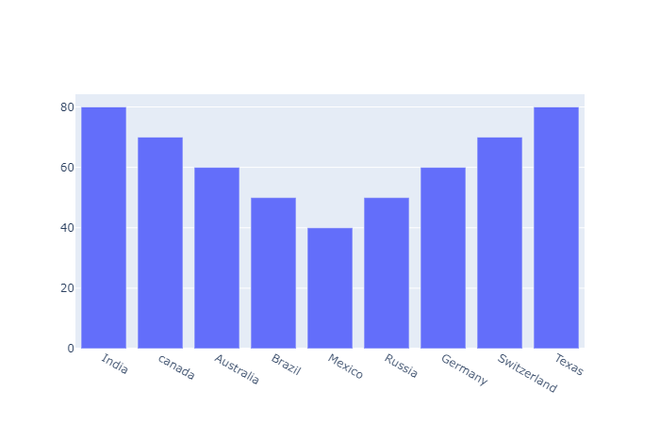
- Bar charts: Bar charts are used when we want to compare different groups of data and make inferences of which groups are highest and which groups are common and compare how one group is performing compared to others.
Python3
import numpy as np
import plotly
import plotly.graph_objects as go
import plotly.offline as pyo
from plotly.offline import init_notebook_mode
init_notebook_mode(connected = True)
countries=['India', 'canada',
'Australia','Brazil',
'Mexico','Russia',
'Germany','Switzerland',
'Texas']
fig = go.Figure([go.Bar(x=countries,
y=[80,70,60,50,
40,50,60,70,80])])
fig.show()
|
Output:
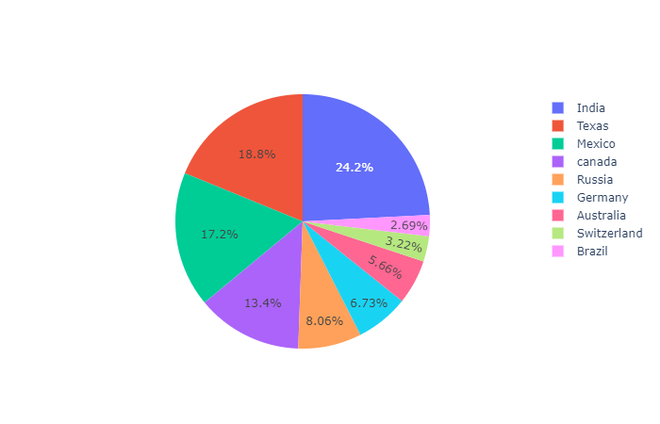
- Pie chart: A pie chart represents the distribution of different variables among total. In the pie chart each slice shows its contribution to the total amount.
Python3
import numpy as np
import plotly
import plotly.graph_objects as go
import plotly.offline as pyo
from plotly.offline import init_notebook_mode
init_notebook_mode(connected = True)
countries=['India', 'canada',
'Australia','Brazil',
'Mexico','Russia',
'Germany','Switzerland',
'Texas']
values = [4500, 2500, 1053, 500,
3200, 1500, 1253, 600, 3500]
fig = go.Figure(data=[go.Pie(labels=countries,
values=values)])
fig.show()
|
Output:
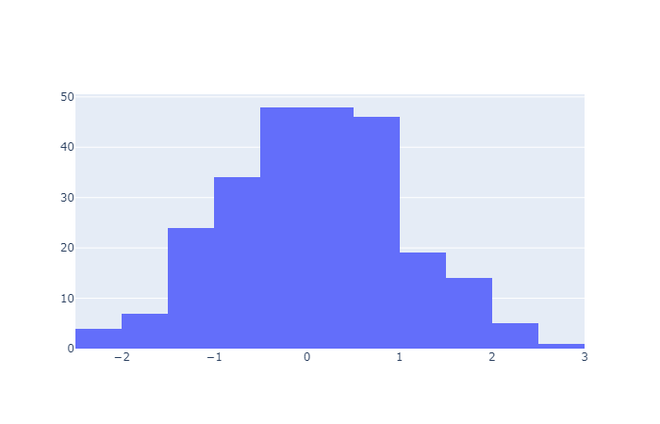
- Histogram: A histogram plots the continuous distribution of variable as series of bars and each bar indicates the frequency of the occurring value in a variable. In order to use a histogram, we simply require a variable that takes continuous numeric values
Python3
import numpy as np
import plotly
import plotly.graph_objects as go
import plotly.offline as pyo
from plotly.offline import init_notebook_mode
init_notebook_mode(connected = True)
np.random.seed(42)
x = np.random.randn(250)
fig = go.Figure(data=[go.Histogram(x=x)])
fig.show()
|
Output:
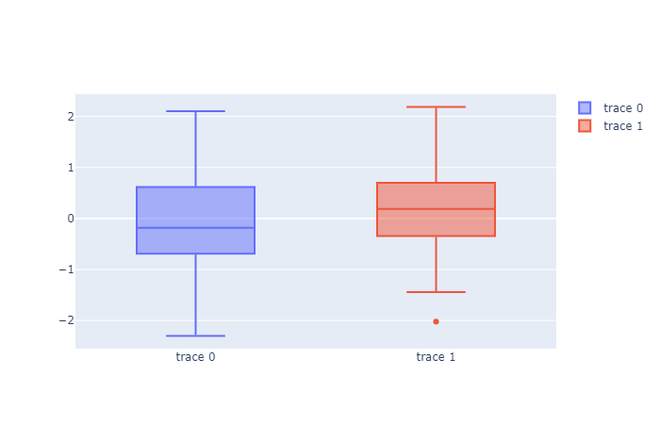
- Box plot: A box plot is the representation of a statistical summary. Minimum, First Quartile, Median, Third Quartile, Maximum.
Python3
import numpy as np
import plotly
import plotly.graph_objects as go
import plotly.offline as pyo
from plotly.offline import init_notebook_mode
init_notebook_mode(connected = True)
np.random.seed(42)
y = np.random.randn(50)
y1 = np.random.randn(50)
fig = go.Figure()
fig.add_trace(go.Box(y=y))
fig.add_trace(go.Box(y=y1))
fig.show()
|
Output:
Like Article
Suggest improvement
Share your thoughts in the comments
Please Login to comment...