Get the statistical summary and nature of the DataFrame in R
Last Updated :
07 Apr, 2021
In this article, we will see how to find the statistics of the given data frame. We will use the summary() function to get the statistics for each column:
Syntax: summary(dataframe_name)
The result produced will contain the following details:
- Minimum value – returns the minimum value from each column
- Maximum value – returns the maximum value from each column
- Mean – returns the mean value from each column
- Median – returns the median from each column
- 1st quartile – returns the 1st quartile from each column
- 3rd quartile – returns the 3rd quartile from each column.
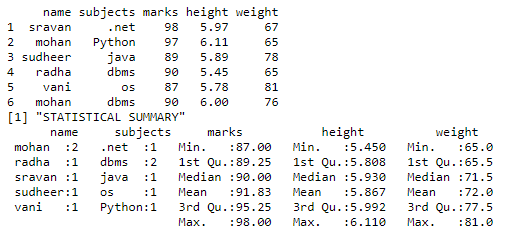
Example 1: In this example data, we had taken student marks, height, weight, and marks, so we are calculating the summary of that two columns.
R
name = c("sravan", "mohan", "sudheer",
"radha", "vani", "mohan")
subjects = c(".net", "Python", "java",
"dbms", "os", "dbms")
marks = c(98, 97, 89, 90, 87, 90)
height = c(5.97, 6.11, 5.89, 5.45, 5.78, 6.0)
weight = c(67, 65, 78, 65, 81, 76)
data = data.frame(name, subjects,
marks, height, weight)
print(data)
print("STATISTICAL SUMMARY")
print(summary(data))
|
Output:
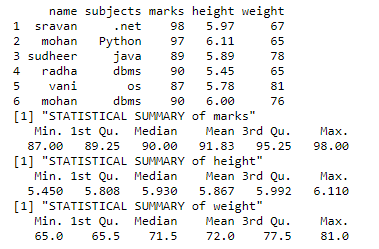
Example 2: In this example, we are getting a statistical summary of individual columns
R
name = c("sravan","mohan","sudheer",
"radha","vani","mohan")
subjects = c(".net","Python","java",
"dbms","os","dbms")
marks=c(98,97,89,90,87,90)
height=c(5.97,6.11,5.89,
5.45,5.78,6.0)
weight=c(67,65,78,65,81,76)
data=data.frame(name,subjects,marks,
height,weight)
print(data)
print("STATISTICAL SUMMARY of marks")
print(summary(data$marks))
print("STATISTICAL SUMMARY of height")
print(summary(data$height))
print("STATISTICAL SUMMARY of weight")
print(summary(data$weight))
|
Output:
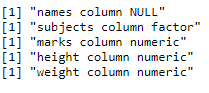
Finding Nature of the data frame:
We can use class() function to get the nature of the dataframe.
It will return:
- Either data is NULL or not
- The datatype of a particular column in a dataframe
Syntax: class(dataframe$column_name)
Example:
R
name = c("sravan","mohan","sudheer",
"radha","vani","mohan")
subjects = c(".net","Python","java",
"dbms","os","dbms")
marks=c(98,97,89,90,87,90)
height=c(5.97,6.11,5.89,
5.45,5.78,6.0)
weight=c(67,65,78,65,81,76)
data=data.frame(name,subjects,marks,
height,weight)
print(paste("names column",class(data$names)))
print(paste("subjects column",class(data$subjects)))
print(paste("marks column",class(data$marks)))
print(paste("height column",class(data$height)))
print(paste("weight column",class(data$weight)))
|
Output:
Like Article
Suggest improvement
Share your thoughts in the comments
Please Login to comment...